
Page 209 - Origin and Prediction of Abnormal Formation Pressures
P. 209
184 E AMINZADEH, G.V. CHILINGAR AND J.O. ROBERTSON JR.
Control Well Area Prospect Area
q t,
....
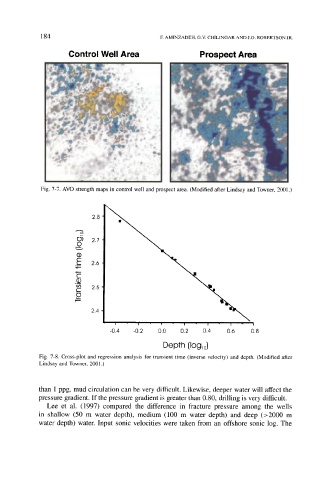
Fig. 7-7. AVO strength maps in control well and prospect area. (Modified after Lindsay and Towner, 2001.)
2,8
o
C)') 2,7
O
(b
~ 2,6
-.t--
-,t-- c-"
~ 2,5
c-"
i-.--
2.4
-0,4 -0,2 0,0 0,2 0,4 0,6 0,8
Depth [Iog,0]
Fig. 7-8. Cross-plot and regression analysis for transient time (inverse velocity) and depth. (Modified after
Lindsay and Towner, 2001.)
than 1 ppg, mud circulation can be very difficult. Likewise, deeper water will affect the
pressure gradient. If the pressure gradient is greater than 0.80, drilling is very difficult.
Lee et al. (1997) compared the difference in fracture pressure among the wells
in shallow (50 m water depth), medium (100 m water depth) and deep (>2000 m
water depth) water. Input sonic velocities were taken from an offshore sonic log. The