
Page 208 - Origin and Prediction of Abnormal Formation Pressures
P. 208
SEISMIC METHODS OF PRESSURE PREDICTION 183
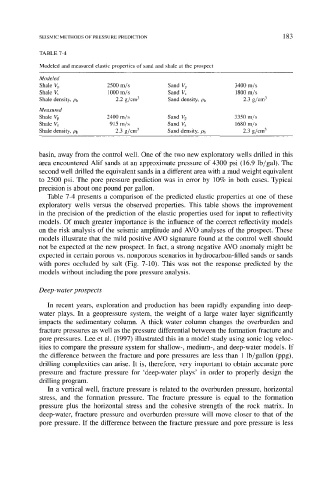
TABLE 7-4
Modeled and measured elastic properties of sand and shale at the prospect
Modeled
Shale Vp 2500 m/s Sand Vp 3400 m/s
Shale Vs 1000 m/s Sand Vs 1800 m/s
Shale density, Pb 2.2 g/cm 3 Sand density, Pb 2.3 g/cm 3
Measured
Shale Vp 2400 m/s Sand Vp 3350 m/s
Shale Vs 915 m/s Sand Vs 1680 m/s
Shale density, Pb 2.3 g/cm 3 Sand density, Pb 2.3 g/cm 3
basin, away from the control well. One of the two new exploratory wells drilled in this
area encountered Alif sands at an approximate pressure of 4300 psi (16.9 lb/gal). The
second well drilled the equivalent sands in a different area with a mud weight equivalent
to 2500 psi. The pore pressure prediction was in error by 10% in both cases. Typical
precision is about one pound per gallon.
Table 7-4 presents a comparison of the predicted elastic properties at one of these
exploratory wells versus the observed properties. This table shows the improvement
in the precision of the prediction of the elastic properties used for input to reflectivity
models. Of much greater importance is the influence of the correct reflectivity models
on the risk analysis of the seismic amplitude and AVO analyses of the prospect. These
models illustrate that the mild positive AVO signature found at the control well should
not be expected at the new prospect. In fact, a strong negative AVO anomaly might be
expected in certain porous vs. nonporous scenarios in hydrocarbon-filled sands or sands
with pores occluded by salt (Fig. 7-10). This was not the response predicted by the
models without including the pore pressure analysis.
Deep-water prospects
In recent years, exploration and production has been rapidly expanding into deep-
water plays. In a geopressure system, the weight of a large water layer significantly
impacts the sedimentary column. A thick water column changes the overburden and
fracture pressures as well as the pressure differential between the formation fracture and
pore pressures. Lee et al. (1997) illustrated this in a model study using sonic log veloc-
ities to compare the pressure system for shallow-, medium-, and deep-water models. If
the difference between the fracture and pore pressures are less than 1 lb/gallon (ppg),
drilling complexities can arise. It is, therefore, very important to obtain accurate pore
pressure and fracture pressure for 'deep-water plays' in order to properly design the
drilling program.
In a vertical well, fracture pressure is related to the overburden pressure, horizontal
stress, and the formation pressure. The fracture pressure is equal to the formation
pressure plus the horizontal stress and the cohesive strength of the rock matrix. In
deep-water, fracture pressure and overburden pressure will move closer to that of the
pore pressure. If the difference between the fracture pressure and pore pressure is less