
Page 101 - Orlicky's Material Requirements Planning
P. 101
80 PART 2 Concepts
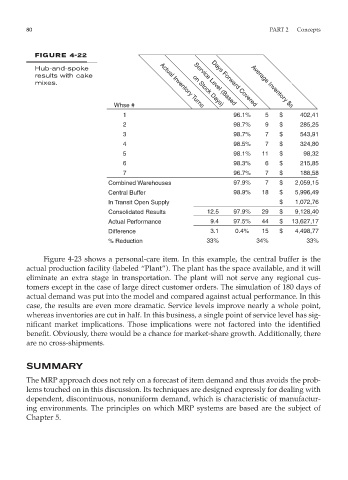
FIGURE 4-22
Hub-and-spoke
results with cake
mixes. Actual Inventory Turns Days Forward Covered
Whse #
Service Level (Based
on Stock Days)
Average Inventory $s
1 96.1% 5 $ 402,41
2 98.7% 9 $ 285,25
3 98.7% 7 $ 543,91
4 98.5% 7 $ 324,80
5 98.1% 11 $ 98,32
6 98.3% 6 $ 215,85
7 96.7% 7 $ 188,58
Combined Warehouses 97.9% 7 $ 2,059,15
Central Buffer 98.9% 18 $ 5,996,49
In Transit Open Supply $ 1,072,76
Consolidated Results 12.5 97.9% 29 $ 9,128,40
Actual Performance 9.4 97.5% 44 $ 13,627,17
Difference 3.1 0.4% 15 $ 4,498,77
% Reduction 33% 34% 33%
Figure 4-23 shows a personal-care item. In this example, the central buffer is the
actual production facility (labeled “Plant”). The plant has the space available, and it will
eliminate an extra stage in transportation. The plant will not serve any regional cus-
tomers except in the case of large direct customer orders. The simulation of 180 days of
actual demand was put into the model and compared against actual performance. In this
case, the results are even more dramatic. Service levels improve nearly a whole point,
whereas inventories are cut in half. In this business, a single point of service level has sig-
nificant market implications. Those implications were not factored into the identified
benefit. Obviously, there would be a chance for market-share growth. Additionally, there
are no cross-shipments.
SUMMARY
The MRP approach does not rely on a forecast of item demand and thus avoids the prob-
lems touched on in this discussion. Its techniques are designed expressly for dealing with
dependent, discontinuous, nonuniform demand, which is characteristic of manufactur-
ing environments. The principles on which MRP systems are based are the subject of
Chapter 5.