
Page 96 - Orlicky's Material Requirements Planning
P. 96
76 PART 2 Concepts
shaped like a V. In Figure 4-18, once inventory is pushed out to region 1, it is unavailable
to the other regions in the immediate term. In the longer term, it can be made available,
but only through costly realignment activity or cross-shipping.
As demand variability increases, it is harder to predict how much inventory will be
required to protect against it. This is especially true when the reliability of the plant lead
time is considered as part of the time frame a regional center must protect. If shortage
penalties are high, demand variability is relatively high, and the plant lead time is a fac-
tor in the plan, then the likely situation at the regional location is either high inventory or
frequent shortage. Combine this with the fact that the closer the inventory is to the point
of consumption, the better it can meet the market’s needs. The net result is that a signifi-
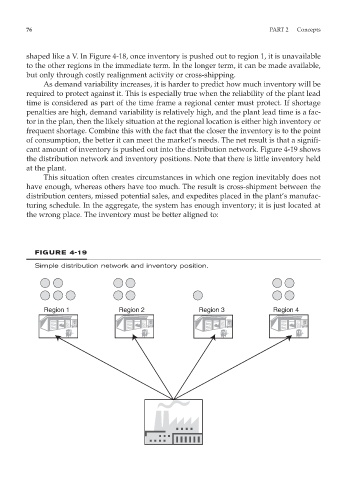
cant amount of inventory is pushed out into the distribution network. Figure 4-19 shows
the distribution network and inventory positions. Note that there is little inventory held
at the plant.
This situation often creates circumstances in which one region inevitably does not
have enough, whereas others have too much. The result is cross-shipment between the
distribution centers, missed potential sales, and expedites placed in the plant’s manufac-
turing schedule. In the aggregate, the system has enough inventory; it is just located at
the wrong place. The inventory must be better aligned to:
FIGURE 4-19
Simple distribution network and inventory position.
Region 1 Region 2 Region 3 Region 4