
Page 214 - Orlicky's Material Requirements Planning
P. 214
CHAPTER 10 A New Way of Looking at Things 193
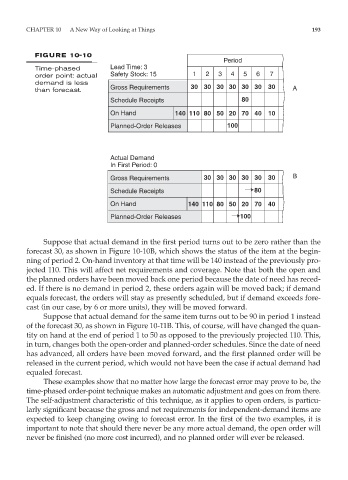
FIGURE 10-10
Period
Time-phased Lead Time: 3
order point: actual Safety Stock: 15 1 2 3 4 5 6 7
demand is less
than forecast. Gross Requirements 30 30 30 30 30 30 30 A
Schedule Receipts 80
On Hand 140 110 80 50 20 70 40 10
Planned-Order Releases 100
Actual Demand
In First Period: 0
Gross Requirements 30 30 30 30 30 30 B
Schedule Receipts 80
On Hand 140 110 80 50 20 70 40
Planned-Order Releases 100
Suppose that actual demand in the first period turns out to be zero rather than the
forecast 30, as shown in Figure 10-10B, which shows the status of the item at the begin-
ning of period 2. On-hand inventory at that time will be 140 instead of the previously pro-
jected 110. This will affect net requirements and coverage. Note that both the open and
the planned orders have been moved back one period because the date of need has reced-
ed. If there is no demand in period 2, these orders again will be moved back; if demand
equals forecast, the orders will stay as presently scheduled, but if demand exceeds fore-
cast (in our case, by 6 or more units), they will be moved forward.
Suppose that actual demand for the same item turns out to be 90 in period 1 instead
of the forecast 30, as shown in Figure 10-11B. This, of course, will have changed the quan-
tity on hand at the end of period 1 to 50 as opposed to the previously projected 110. This,
in turn, changes both the open-order and planned-order schedules. Since the date of need
has advanced, all orders have been moved forward, and the first planned order will be
released in the current period, which would not have been the case if actual demand had
equaled forecast.
These examples show that no matter how large the forecast error may prove to be, the
time-phased order-point technique makes an automatic adjustment and goes on from there.
The self-adjustment characteristic of this technique, as it applies to open orders, is particu-
larly significant because the gross and net requirements for independent-demand items are
expected to keep changing owing to forecast error. In the first of the two examples, it is
important to note that should there never be any more actual demand, the open order will
never be finished (no more cost incurred), and no planned order will ever be released.