
Page 428 - Orlicky's Material Requirements Planning
P. 428
406 PART 4 Looking Backward and Forward
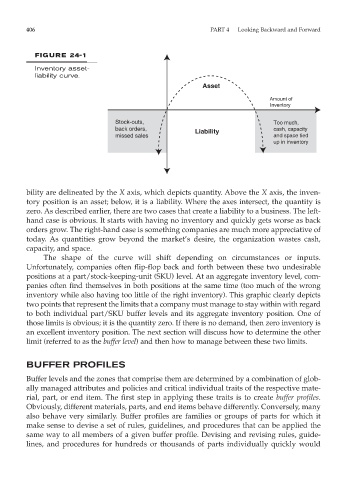
FIGURE 24-1
Inventory asset-
liability curve.
Asset
Amount of
Inventory
Stock-outs, Too much,
back orders, Liability cash, capacity
missed sales and space tied
up in inventory
bility are delineated by the X axis, which depicts quantity. Above the X axis, the inven-
tory position is an asset; below, it is a liability. Where the axes intersect, the quantity is
zero. As described earlier, there are two cases that create a liability to a business. The left-
hand case is obvious. It starts with having no inventory and quickly gets worse as back
orders grow. The right-hand case is something companies are much more appreciative of
today. As quantities grow beyond the market’s desire, the organization wastes cash,
capacity, and space.
The shape of the curve will shift depending on circumstances or inputs.
Unfortunately, companies often flip-flop back and forth between these two undesirable
positions at a part/stock-keeping-unit (SKU) level. At an aggregate inventory level, com-
panies often find themselves in both positions at the same time (too much of the wrong
inventory while also having too little of the right inventory). This graphic clearly depicts
two points that represent the limits that a company must manage to stay within with regard
to both individual part/SKU buffer levels and its aggregate inventory position. One of
those limits is obvious; it is the quantity zero. If there is no demand, then zero inventory is
an excellent inventory position. The next section will discuss how to determine the other
limit (referred to as the buffer level) and then how to manage between these two limits.
BUFFER PROFILES
Buffer levels and the zones that comprise them are determined by a combination of glob-
ally managed attributes and policies and critical individual traits of the respective mate-
rial, part, or end item. The first step in applying these traits is to create buffer profiles.
Obviously, different materials, parts, and end items behave differently. Conversely, many
also behave very similarly. Buffer profiles are families or groups of parts for which it
make sense to devise a set of rules, guidelines, and procedures that can be applied the
same way to all members of a given buffer profile. Devising and revising rules, guide-
lines, and procedures for hundreds or thousands of parts individually quickly would