
Page 431 - Orlicky's Material Requirements Planning
P. 431
CHAPTER 24 Buffer Profiles and Level Determination 409
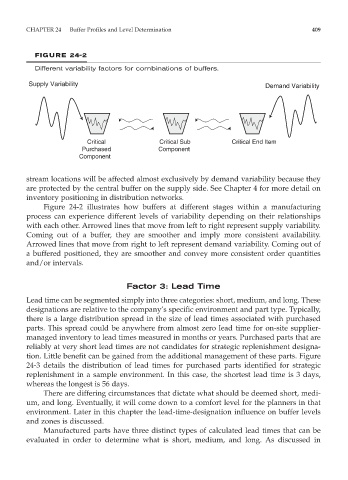
FIGURE 24-2
Different variability factors for combinations of buffers.
Supply Variability Demand Variability
Critical Critical Sub Critical End Item
Purchased Component
Component
stream locations will be affected almost exclusively by demand variability because they
are protected by the central buffer on the supply side. See Chapter 4 for more detail on
inventory positioning in distribution networks.
Figure 24-2 illustrates how buffers at different stages within a manufacturing
process can experience different levels of variability depending on their relationships
with each other. Arrowed lines that move from left to right represent supply variability.
Coming out of a buffer, they are smoother and imply more consistent availability.
Arrowed lines that move from right to left represent demand variability. Coming out of
a buffered positioned, they are smoother and convey more consistent order quantities
and/or intervals.
Factor 3: Lead Time
Lead time can be segmented simply into three categories: short, medium, and long. These
designations are relative to the company’s specific environment and part type. Typically,
there is a large distribution spread in the size of lead times associated with purchased
parts. This spread could be anywhere from almost zero lead time for on-site supplier-
managed inventory to lead times measured in months or years. Purchased parts that are
reliably at very short lead times are not candidates for strategic replenishment designa-
tion. Little benefit can be gained from the additional management of these parts. Figure
24-3 details the distribution of lead times for purchased parts identified for strategic
replenishment in a sample environment. In this case, the shortest lead time is 3 days,
whereas the longest is 56 days.
There are differing circumstances that dictate what should be deemed short, medi-
um, and long. Eventually, it will come down to a comfort level for the planners in that
environment. Later in this chapter the lead-time-designation influence on buffer levels
and zones is discussed.
Manufactured parts have three distinct types of calculated lead times that can be
evaluated in order to determine what is short, medium, and long. As discussed in