
Page 434 - Orlicky's Material Requirements Planning
P. 434
412 PART 4 Looking Backward and Forward
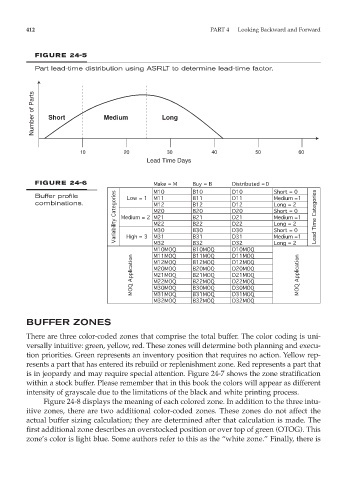
FIGURE 24-5
Part lead-time distribution using ASRLT to determine lead-time factor.
Number of Parts Short Medium Long
10 20 30 40 50 60
Lead Time Days
FIGURE 24-6
Buffer profile
combinations.
BUFFER ZONES
There are three color-coded zones that comprise the total buffer. The color coding is uni-
versally intuitive: green, yellow, red. These zones will determine both planning and execu-
tion priorities. Green represents an inventory position that requires no action. Yellow rep-
resents a part that has entered its rebuild or replenishment zone. Red represents a part that
is in jeopardy and may require special attention. Figure 24-7 shows the zone stratification
within a stock buffer. Please remember that in this book the colors will appear as different
intensity of grayscale due to the limitations of the black and white printing process.
Figure 24-8 displays the meaning of each colored zone. In addition to the three intu-
itive zones, there are two additional color-coded zones. These zones do not affect the
actual buffer sizing calculation; they are determined after that calculation is made. The
first additional zone describes an overstocked position or over top of green (OTOG). This
zone’s color is light blue. Some authors refer to this as the “white zone.” Finally, there is