
Page 435 - Orlicky's Material Requirements Planning
P. 435
CHAPTER 24 Buffer Profiles and Level Determination 413
FIGURE 24-7
From this… …to this.
Moving to zone
stratifications in a Green
stock buffer.
Yellow
Red
FIGURE 24-8
The meaning of each buffer zone.
Stock Out ALERT! Rebuild OK OTOG/Too Much
a color-coded zone that displays an out-of-stock situation with demand. This zone’s color
is dark red. Some authors refer to this as the “black zone.”
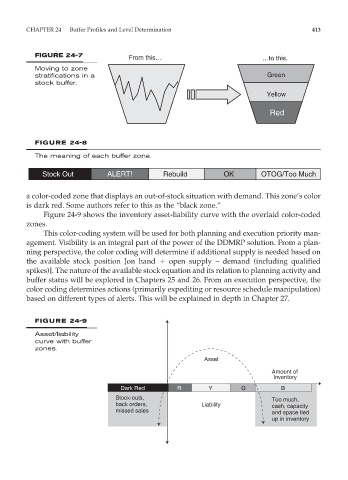
Figure 24-9 shows the inventory asset-liability curve with the overlaid color-coded
zones.
This color-coding system will be used for both planning and execution priority man-
agement. Visibility is an integral part of the power of the DDMRP solution. From a plan-
ning perspective, the color coding will determine if additional supply is needed based on
the available stock position [on hand open supply – demand (including qualified
spikes)]. The nature of the available stock equation and its relation to planning activity and
buffer status will be explored in Chapters 25 and 26. From an execution perspective, the
color coding determines actions (primarily expediting or resource schedule manipulation)
based on different types of alerts. This will be explained in depth in Chapter 27.
FIGURE 24-9
Asset/liability
curve with buffer
zones.
Asset
Amount of
Inventory
Dark Red R Y G B
Stock-outs, Too much,
back orders, Liability cash, capacity
missed sales and space tied
up in inventory