
Page 436 - Orlicky's Material Requirements Planning
P. 436
414 PART 4 Looking Backward and Forward
CALCULATING BUFFER LEVELS
As mentioned earlier, the summation of the green, yellow, and red zones will yield the
top level of the buffer, or top of green (TOG). Each of these zones is determined by apply-
ing rules determined for a global attribute against certain individual part traits. Figure
24-10 shows the minimum amount of data needed to determine zone sizes and thus
buffer levels for purchased, manufactured, and distributed parts. Note that there is a spe-
cial input for distributed parts called location. This allows parts/SKUs at different for-
ward locations to have different buffer profiles and individual inputs applied.
Each zone within the buffer (G, Y, or R) is sized by an expression of average daily
usage (ADU) over a percentage of lead time (expressed in days). The green zone also will
have the option of being expressed as the minimum order quantity (if present) when that
minimum order quantity is significant. Determining the significance of the MOQ will be
discussed later. The yellow zone for all buffer profiles is usually set at 100 percent of
usage over lead time. The red zone has two subzones. The summation of these two sub-
zones will define the total red zone quantity. One subzone is called red zone base. The other
subzone is called red zone safety. These subzones are affected by different buffer profile
inputs. This is diagrammed in Figure 24-11.
Buffer level or TOG red zone base red zone safety yellow zone green zone
FIGURE 24-10
Determining Buffer Levels and Zones
Determining
buffer levels and Group Trait Inputs Individual Part/SKU Inputs
zones.
• Lead Time Category • Average Daily Usage
• Make, Buy, or Distributed • Discrete Lead Time
– ASR Lead Time
• Variability Category
– Purchasing Lead Time
• Significant MOQ Factor – Transportation Lead Time
• Ordering Policy
– Minimum
– Maximum
– Multiple
• Location (Distributed Parts)
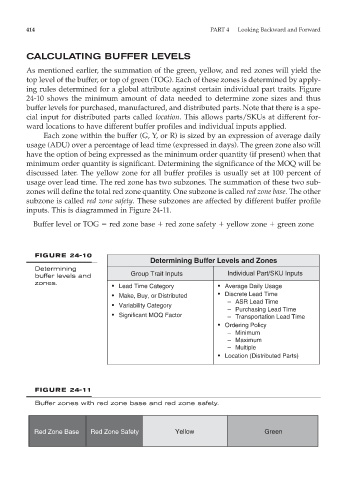
FIGURE 24-11
Buffer zones with red zone base and red zone safety.
Red Zone Base Red Zone Safety Yellow Green