
Page 440 - Orlicky's Material Requirements Planning
P. 440
418 PART 4 Looking Backward and Forward
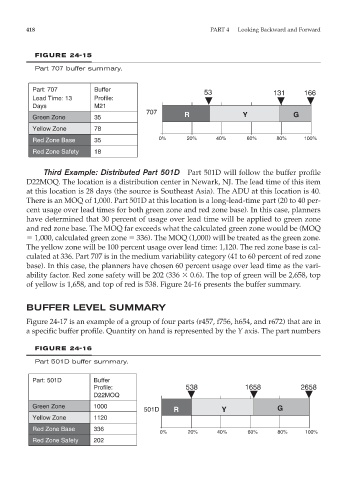
FIGURE 24-15
Part 707 buffer summary.
Part: 707 Buffer
53 131 166
Lead Time: 13 Profile:
Days M21
707
Green Zone 35 R Y G
Yellow Zone 78
Red Zone Base 35 0% 20% 40% 60% 80% 100%
Red Zone Safety 18
Third Example: Distributed Part 501D Part 501D will follow the buffer profile
D22MOQ. The location is a distribution center in Newark, NJ. The lead time of this item
at this location is 28 days (the source is Southeast Asia). The ADU at this location is 40.
There is an MOQ of 1,000. Part 501D at this location is a long-lead-time part (20 to 40 per-
cent usage over lead times for both green zone and red zone base). In this case, planners
have determined that 30 percent of usage over lead time will be applied to green zone
and red zone base. The MOQ far exceeds what the calculated green zone would be (MOQ
1,000, calculated green zone 336). The MOQ (1,000) will be treated as the green zone.
The yellow zone will be 100 percent usage over lead time: 1,120. The red zone base is cal-
culated at 336. Part 707 is in the medium variability category (41 to 60 percent of red zone
base). In this case, the planners have chosen 60 percent usage over lead time as the vari-
ability factor. Red zone safety will be 202 (336 0.6). The top of green will be 2,658, top
of yellow is 1,658, and top of red is 538. Figure 24-16 presents the buffer summary.
BUFFER LEVEL SUMMARY
Figure 24-17 is an example of a group of four parts (r457, f756, h654, and r672) that are in
a specific buffer profile. Quantity on hand is represented by the Y axis. The part numbers
FIGURE 24-16
Part 501D buffer summary.
Part: 501D Buffer
Profile: 538 1658 2658
D22MOQ
Green Zone 1000
501D R Y G
Yellow Zone 1120
Red Zone Base 336
0% 20% 40% 60% 80% 100%
Red Zone Safety 202