
Page 442 - Orlicky's Material Requirements Planning
P. 442
420 PART 4 Looking Backward and Forward
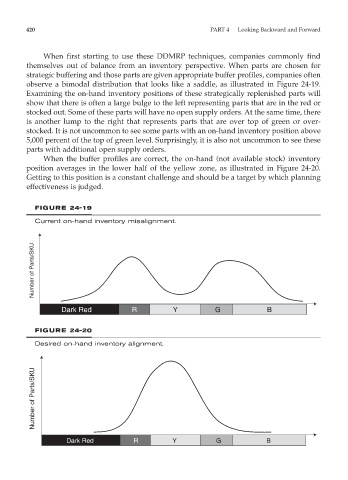
When first starting to use these DDMRP techniques, companies commonly find
themselves out of balance from an inventory perspective. When parts are chosen for
strategic buffering and those parts are given appropriate buffer profiles, companies often
observe a bimodal distribution that looks like a saddle, as illustrated in Figure 24-19.
Examining the on-hand inventory positions of these strategically replenished parts will
show that there is often a large bulge to the left representing parts that are in the red or
stocked out. Some of these parts will have no open supply orders. At the same time, there
is another lump to the right that represents parts that are over top of green or over-
stocked. It is not uncommon to see some parts with an on-hand inventory position above
5,000 percent of the top of green level. Surprisingly, it is also not uncommon to see these
parts with additional open supply orders.
When the buffer profiles are correct, the on-hand (not available stock) inventory
position averages in the lower half of the yellow zone, as illustrated in Figure 24-20.
Getting to this position is a constant challenge and should be a target by which planning
effectiveness is judged.
FIGURE 24-19
Current on-hand inventory misalignment.
Number of Parts/SKU
Dark Red R Y G B
FIGURE 24-20
Desired on-hand inventory alignment.
Number of Parts/SKU
Dark Red R Y G B