
Page 446 - Orlicky's Material Requirements Planning
P. 446
424 PART 4 Looking Backward and Forward
for each part/SKU, circumstances may occur that will make it either overreactive or
underreactive. This is the purpose for alerts or early-warning indicators. More on those
types of alerts is provided in the manual adjustments section.
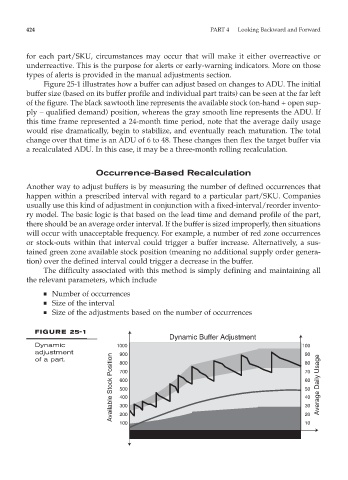
Figure 25-1 illustrates how a buffer can adjust based on changes to ADU. The initial
buffer size (based on its buffer profile and individual part traits) can be seen at the far left
of the figure. The black sawtooth line represents the available stock (on-hand + open sup-
ply – qualified demand) position, whereas the gray smooth line represents the ADU. If
this time frame represented a 24-month time period, note that the average daily usage
would rise dramatically, begin to stabilize, and eventually reach maturation. The total
change over that time is an ADU of 6 to 48. These changes then flex the target buffer via
a recalculated ADU. In this case, it may be a three-month rolling recalculation.
Occurrence-Based Recalculation
Another way to adjust buffers is by measuring the number of defined occurrences that
happen within a prescribed interval with regard to a particular part/SKU. Companies
usually use this kind of adjustment in conjunction with a fixed-interval/reorder invento-
ry model. The basic logic is that based on the lead time and demand profile of the part,
there should be an average order interval. If the buffer is sized improperly, then situations
will occur with unacceptable frequency. For example, a number of red zone occurrences
or stock-outs within that interval could trigger a buffer increase. Alternatively, a sus-
tained green zone available stock position (meaning no additional supply order genera-
tion) over the defined interval could trigger a decrease in the buffer.
The difficulty associated with this method is simply defining and maintaining all
the relevant parameters, which include
■ Number of occurrences
■ Size of the interval
■ Size of the adjustments based on the number of occurrences
FIGURE 25-1
Dynamic Buffer Adjustment
Dynamic 1000 100
adjustment 900 90
Available Stock Position 600 60 Average Daily Usage
of a part. 800 80
70
700
500
50
400
40
300
20
200
10
100 30