
Page 441 - Orlicky's Material Requirements Planning
P. 441
CHAPTER 24 Buffer Profiles and Level Determination 419
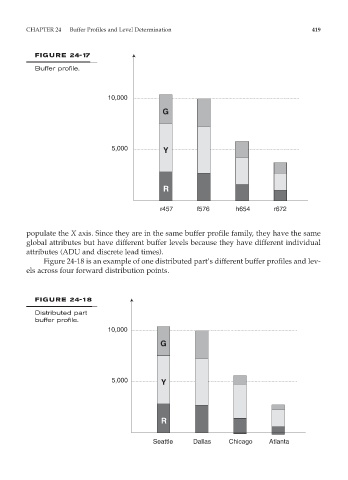
FIGURE 24-17
Buffer profile.
10,000
G
5,000 Y
R
r457 f576 h654 r672
populate the X axis. Since they are in the same buffer profile family, they have the same
global attributes but have different buffer levels because they have different individual
attributes (ADU and discrete lead times).
Figure 24-18 is an example of one distributed part’s different buffer profiles and lev-
els across four forward distribution points.
FIGURE 24-18
Distributed part
buffer profile.
10,000
G
5,000 Y
R
Seattle Dallas Chicago Atlanta