
Page 438 - Orlicky's Material Requirements Planning
P. 438
416 PART 4 Looking Backward and Forward
(rebuild zone) will be penetrated more frequently. This means that there will be a steady
stream of open supply orders. This extends a larger percentage of the buffer position to
inbound supply. Having more open supply orders also means that the red zone base can
be minimized. The presence of a significant MOQ often will block or challenge this green
zone strategy owing to the inherent lumpiness caused by the MOQ.
Two steps are necessary to determine if an MOQ is significant. First, the part’s green
zone is calculated based on the lead-time category it falls in without consideration of
MOQ. Second, a comparison must be made of the calculated green zone quantity and that
MOQ. If the order minimum is greater than the size of the calculated green zone, then the
MOQ is significant. The green zone then is sized to the MOQ.
For example, Part XYZ has an ADU of 6 and a lead time of 20 days. It is coded a
long-lead-time part, in which its green zone will be 30 percent of usage over lead time (36
units). If this part has an MOQ of 48 units, this would qualify as a significant MOQ (48
36). This designation means that the buffer profile of this part will be changed to an MOQ
profile. Under MOQ profiles, the green zone is set to the MOQ (48 units). In this exam-
ple, the MOQ equals 8 days of average daily usage [48 units (MOQ)/6 units (ADU) 8
days]. Eight days, incidentally, means that the green zone will end up being sized at 40
percent of usage over lead time.
Variability Category Buffer Impact
The variability category will size the red zone safety portion of the total red zone. Early
in development of this solution, the thinking was that red zone safety might best be
described as a factor of ADU (e.g., 2 ADU, 3 ADU, etc.). This quickly creates a prob-
lem for the variability factor to be managed effectively at a global level. Within a buffer
profile there still can be relatively wide discrepancies between the discrete lead times of
parts, especially long-lead-time parts. The same issue applies to expressing red zone safe-
ty as a percentage of usage over lead time. The most effective heuristic is that red zone
safety should be an expression of a percentage of the red zone base. By doing this, there
is a smoothing effect that happens between parts that have lead-time disparities within
the same buffer profile.
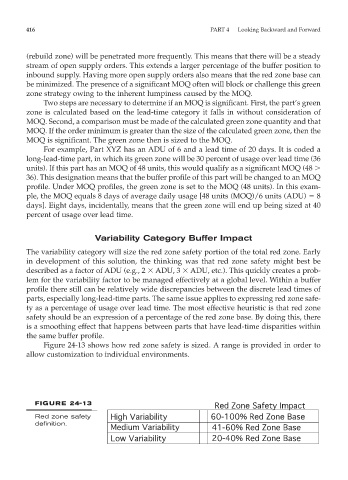
Figure 24-13 shows how red zone safety is sized. A range is provided in order to
allow customization to individual environments.
FIGURE 24-13
Red zone safety
definition.