
Page 437 - Orlicky's Material Requirements Planning
P. 437
CHAPTER 24 Buffer Profiles and Level Determination 415
Calculating Average Daily Usage (ADU)
Any average is only as relevant as the period over which the equation was applied. Taking
too short a range produces just as unrealistic a number as taking too long a range. If a sig-
nificant event occurs that has altered demand profiles dramatically within a relevant
range, then planners should be cautious. If the significant event is an anomaly and will
revert back to normal behavior, then the abnormal usage should be excluded. However, if
the dramatic shift is indicative of what the future might look like for this part, then that
data should be included or at the least factored in. Calculating some ADUs will require the
planner to consult with others in the organization to formulate a valid approach.
For new-product introductions, there will be no history to calculate ADU. For new-
product introductions, there may be only a business case that predicts a certain rate and
volume of market acceptance. In this case, an ADU can be formulated based on that plan.
However, the plan may represent a significant over- or underestimation. At this point,
planners can use the formulated ADU, but additional information is required (described
in Chapter 27) to protect against the over- or underestimations. The second case of no his-
tory to calculate from occurs when the system of record does not record usage. This often
happens in legacy systems. If a company has a modern planning system and these data
are not available, then the lack of availability would be due to poor implementation. The
fortunate news is that most of the time parts chosen for strategic buffering represent the
minority of total parts, a very important minority, but a minority nonetheless. The Pareto
principle is valid here. Planners may need to consult with other relevant personnel to cal-
culate an approximation of ADU that seems realistic. Once the baseline has been estab-
lished, then the ADU can be tracked accurately from that point forward.
Lead-Time Category Buffer Impact
The lead-time category will have a direct impact on the size of the green and red zone
bases. The basic assumption with this category is that the longer the lead time of the
part/SKU, the higher would be the inventory. The cost associated with covering demand
is also higher owing to the higher probability of variance within that longer lead time.
This reinforces the need for the lead-time compression tactics described in Chapter 23.
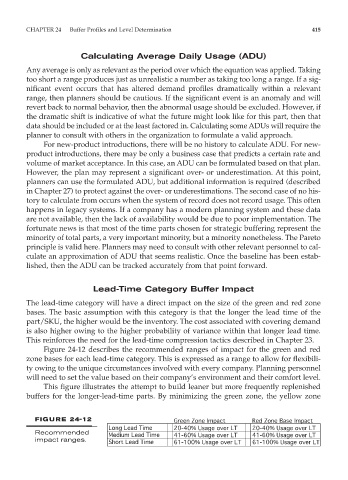
Figure 24-12 describes the recommended ranges of impact for the green and red
zone bases for each lead-time category. This is expressed as a range to allow for flexibili-
ty owing to the unique circumstances involved with every company. Planning personnel
will need to set the value based on their company’s environment and their comfort level.
This figure illustrates the attempt to build leaner but more frequently replenished
buffers for the longer-lead-time parts. By minimizing the green zone, the yellow zone
FIGURE 24-12
Recommended
impact ranges.