
Page 177 - PVT Property Correlations
P. 177
Black Oils Chapter | 7 151
Oil Density
The density of oil is defined as the mass per unit volume. In oil field units,
3
density is expressed in units of lbm/ft . Oil density is usually measured at
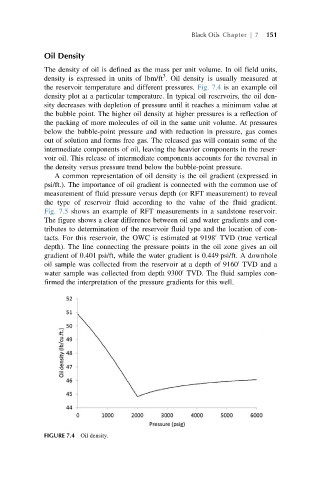
the reservoir temperature and different pressures. Fig. 7.4 is an example oil
density plot at a particular temperature. In typical oil reservoirs, the oil den-
sity decreases with depletion of pressure until it reaches a minimum value at
the bubble point. The higher oil density at higher pressures is a reflection of
the packing of more molecules of oil in the same unit volume. At pressures
below the bubble-point pressure and with reduction in pressure, gas comes
out of solution and forms free gas. The released gas will contain some of the
intermediate components of oil, leaving the heavier components in the reser-
voir oil. This release of intermediate components accounts for the reversal in
the density versus pressure trend below the bubble-point pressure.
A common representation of oil density is the oil gradient (expressed in
psi/ft.). The importance of oil gradient is connected with the common use of
measurement of fluid pressure versus depth (or RFT measurement) to reveal
the type of reservoir fluid according to the value of the fluid gradient.
Fig. 7.5 shows an example of RFT measurements in a sandstone reservoir.
The figure shows a clear difference between oil and water gradients and con-
tributes to determination of the reservoir fluid type and the location of con-
tacts. For this reservoir, the OWC is estimated at 9198 TVD (true vertical
0
depth). The line connecting the pressure points in the oil zone gives an oil
gradient of 0.401 psi/ft, while the water gradient is 0.449 psi/ft. A downhole
oil sample was collected from the reservoir at a depth of 9160 TVD and a
0
0
water sample was collected from depth 9300 TVD. The fluid samples con-
firmed the interpretation of the pressure gradients for this well.
FIGURE 7.4 Oil density.