
Page 23 - PVT Property Correlations
P. 23
4 PVT Property Correlations
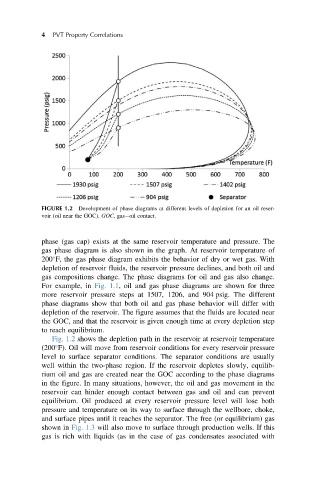
FIGURE 1.2 Development of phase diagrams at different levels of depletion for an oil reser-
voir (oil near the GOC). GOC, gas oil contact.
phase (gas cap) exists at the same reservoir temperature and pressure. The
gas phase diagram is also shown in the graph. At reservoir temperature of
200 F, the gas phase diagram exhibits the behavior of dry or wet gas. With
depletion of reservoir fluids, the reservoir pressure declines, and both oil and
gas compositions change. The phase diagrams for oil and gas also change.
For example, in Fig. 1.1, oil and gas phase diagrams are shown for three
more reservoir pressure steps at 1507, 1206, and 904 psig. The different
phase diagrams show that both oil and gas phase behavior will differ with
depletion of the reservoir. The figure assumes that the fluids are located near
the GOC, and that the reservoir is given enough time at every depletion step
to reach equilibrium.
Fig. 1.2 shows the depletion path in the reservoir at reservoir temperature
(200 F). Oil will move from reservoir conditions for every reservoir pressure
level to surface separator conditions. The separator conditions are usually
well within the two-phase region. If the reservoir depletes slowly, equilib-
rium oil and gas are created near the GOC according to the phase diagrams
in the figure. In many situations, however, the oil and gas movement in the
reservoir can hinder enough contact between gas and oil and can prevent
equilibrium. Oil produced at every reservoir pressure level will lose both
pressure and temperature on its way to surface through the wellbore, choke,
and surface pipes until it reaches the separator. The free (or equilibrium) gas
shown in Fig. 1.3 will also move to surface through production wells. If this
gas is rich with liquids (as in the case of gas condensates associated with