
Page 233 - PVT Property Correlations
P. 233
Chapter 9
Selection of PVT Correlations
Different PVT correlations sometimes yield significantly different results
from the same input. Arbitrary selection of PVT correlations can lead to sig-
nificant errors in engineering calculations.
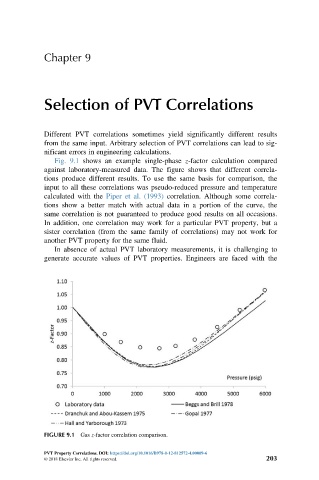
Fig. 9.1 shows an example single-phase z-factor calculation compared
against laboratory-measured data. The figure shows that different correla-
tions produce different results. To use the same basis for comparison, the
input to all these correlations was pseudo-reduced pressure and temperature
calculated with the Piper et al. (1993) correlation. Although some correla-
tions show a better match with actual data in a portion of the curve, the
same correlation is not guaranteed to produce good results on all occasions.
In addition, one correlation may work for a particular PVT property, but a
sister correlation (from the same family of correlations) may not work for
another PVT property for the same fluid.
In absence of actual PVT laboratory measurements, it is challenging to
generate accurate values of PVT properties. Engineers are faced with the
FIGURE 9.1 Gas z-factor correlation comparison.
PVT Property Correlations. DOI: https://doi.org/10.1016/B978-0-12-812572-4.00009-6
© 2018 Elsevier Inc. All rights reserved. 203