
Page 236 - PVT Property Correlations
P. 236
206 PVT Property Correlations
PVT correlations within the cluster by use of a PVT data set. A limited data
set was used in this work.
The applicability ranges for gas and oil correlations can be used to reduce
the number of applicable correlations for a particular fluid. These ranges are
based on the database used to develop each correlation. The ranges are given
in Appendix C, Oil Correlations Range of Applicability and Appendix D,
Gas Correlations Range of Applicability, for oil and gas correlations,
respectively.
Correlation Selection Based on Expert System or Set of Rules
Al-Gathe (2015) developed an expert system (a set of rules) for oil PVT cor-
relation selection. The study checked the accuracy of correlations against a
large database of PVT laboratory-measured data. From the input data for
each correlation, the correlations are ranked according to their accuracy. In
these calculations, intermediate PVT properties required as inputs to the fol-
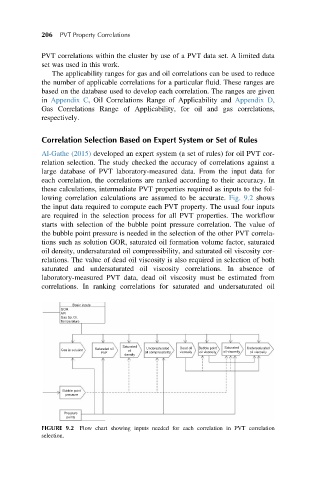
lowing correlation calculations are assumed to be accurate. Fig. 9.2 shows
the input data required to compute each PVT property. The usual four inputs
are required in the selection process for all PVT properties. The workflow
starts with selection of the bubble point pressure correlation. The value of
the bubble point pressure is needed in the selection of the other PVT correla-
tions such as solution GOR, saturated oil formation volume factor, saturated
oil density, undersaturated oil compressibility, and saturated oil viscosity cor-
relations. The value of dead oil viscosity is also required in selection of both
saturated and undersaturated oil viscosity correlations. In absence of
laboratory-measured PVT data, dead oil viscosity must be estimated from
correlations. In ranking correlations for saturated and undersaturated oil
Basic inputs
GOR
API
Gas Sp. Gr.
Temperature
Saturated
Saturated oil Undersaturated Dead oil Bubble point Saturated Undersaturated
Gas in solution oil oil viscosity
FVF oil compressibility viscosity oil viscosity oil viscosity
density
Bubble point
pressure
Pressure
points
FIGURE 9.2 Flow chart showing inputs needed for each correlation in PVT correlation
selection.