
Page 237 - PVT Property Correlations
P. 237
Selection of PVT Correlations Chapter | 9 207
viscosity, Al-Gathe (2015) assumed that dead oil viscosity is known.
Nevertheless, testing this approach on a large data set (which was not used
in development of the expert system) demonstrated the accuracy of this
approach in the majority of cases. This result means that the expert system is
capable of selecting one (sometimes two) correlation(s) for every PVT prop-
erty that provides the values closest to laboratory-measured values.
The rules developed by Al-Gathe (2015) are represented graphically in
Appendix F, Worksheets for Oil PVT Correlations Selection. Although the
correlations used in development of these selection rules were fewer than
those presented in this book, the rules increase the chances of selecting cor-
relations that provide lower error compared to measured values.
Selim (2018) developed an expert system similar to that of Al-Gathe
(2015), but dependent on selection of correlation families (rather than indi-
vidual correlations for each property). Selim (2018) identified the best corre-
lation family to be used for any set of input data. In his study, the input data
for every PVT property correlation are grouped in clusters. One family of
correlations is selected to calculate all PVT properties (e.g., bubble point
pressure, solution GOR, oil formation volume factor, oil compressibility, oil
density, and oil viscosity). The correlation families considered include Al-
Marhoun (1988), Standing (1947), Farshad et al. (1996), etc.
APPLICATIONS FOR PVT CORRELATION SELECTION
Problem 1—Showing the Variation of Calculated Dew Point
From Different Correlations
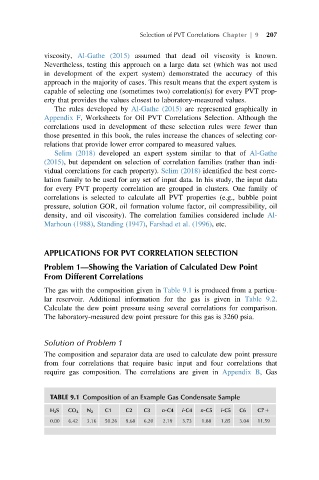
The gas with the composition given in Table 9.1 is produced from a particu-
lar reservoir. Additional information for the gas is given in Table 9.2.
Calculate the dew point pressure using several correlations for comparison.
The laboratory-measured dew point pressure for this gas is 3260 psia.
Solution of Problem 1
The composition and separator data are used to calculate dew point pressure
from four correlations that require basic input and four correlations that
require gas composition. The correlations are given in Appendix B, Gas
TABLE 9.1 Composition of an Example Gas Condensate Sample
H 2 S CO 2 N 2 C1 C2 C3 n-C4 i-C4 n-C5 i-C5 C6 C7 1
0.00 6.42 3.16 50.26 9.68 6.20 2.19 3.73 1.88 1.85 3.04 11.59