
Page 242 - PVT Property Correlations
P. 242
Selection of PVT Correlations Chapter | 9 211
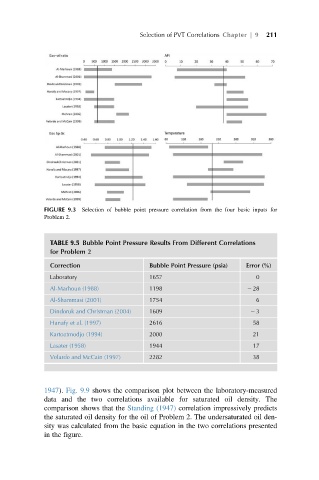
FIGURE 9.3 Selection of bubble point pressure correlation from the four basic inputs for
Problem 2.
TABLE 9.5 Bubble Point Pressure Results From Different Correlations
for Problem 2
Correction Bubble Point Pressure (psia) Error (%)
Laboratory 1657 0
Al-Marhoun (1988) 1198 2 28
Al-Shammasi (2001) 1754 6
Dindoruk and Christman (2004) 1609 2 3
Hanafy et al. (1997) 2616 58
Kartoatmodjo (1994) 2000 21
Lasater (1958) 1944 17
Velarde and McCain (1997) 2282 38
1947). Fig. 9.9 shows the comparison plot between the laboratory-measured
data and the two correlations available for saturated oil density. The
comparison shows that the Standing (1947) correlation impressively predicts
the saturated oil density for the oil of Problem 2. The undersaturated oil den-
sity was calculated from the basic equation in the two correlations presented
in the figure.