
Page 245 - PVT Property Correlations
P. 245
214 PVT Property Correlations
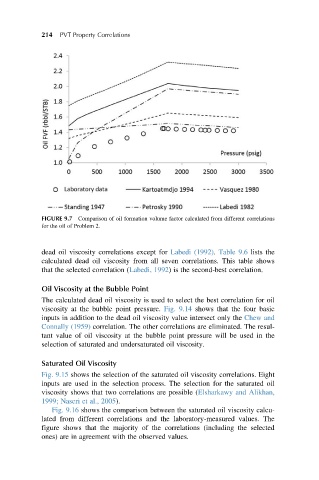
FIGURE 9.7 Comparison of oil formation volume factor calculated from different correlations
for the oil of Problem 2.
dead oil viscosity correlations except for Labedi (1992). Table 9.6 lists the
calculated dead oil viscosity from all seven correlations. This table shows
that the selected correlation (Labedi, 1992) is the second-best correlation.
Oil Viscosity at the Bubble Point
The calculated dead oil viscosity is used to select the best correlation for oil
viscosity at the bubble point pressure. Fig. 9.14 shows that the four basic
inputs in addition to the dead oil viscosity value intersect only the Chew and
Connally (1959) correlation. The other correlations are eliminated. The resul-
tant value of oil viscosity at the bubble point pressure will be used in the
selection of saturated and undersaturated oil viscosity.
Saturated Oil Viscosity
Fig. 9.15 shows the selection of the saturated oil viscosity correlations. Eight
inputs are used in the selection process. The selection for the saturated oil
viscosity shows that two correlations are possible (Elsharkawy and Alikhan,
1999; Naseri et al., 2005).
Fig. 9.16 shows the comparison between the saturated oil viscosity calcu-
lated from different correlations and the laboratory-measured values. The
figure shows that the majority of the correlations (including the selected
ones) are in agreement with the observed values.