
Page 248 - PVT Property Correlations
P. 248
Selection of PVT Correlations Chapter | 9 217
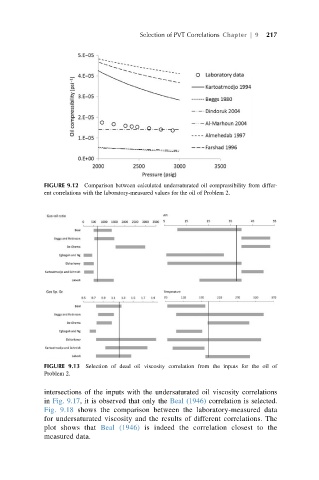
FIGURE 9.12 Comparison between calculated undersaturated oil compressibility from differ-
ent correlations with the laboratory-measured values for the oil of Problem 2.
FIGURE 9.13 Selection of dead oil viscosity correlation from the inputs for the oil of
Problem 2.
intersections of the inputs with the undersaturated oil viscosity correlations
in Fig. 9.17, it is observed that only the Beal (1946) correlation is selected.
Fig. 9.18 shows the comparison between the laboratory-measured data
for undersaturated viscosity and the results of different correlations. The
plot shows that Beal (1946) is indeed the correlation closest to the
measured data.