
Page 251 - PVT Property Correlations
P. 251
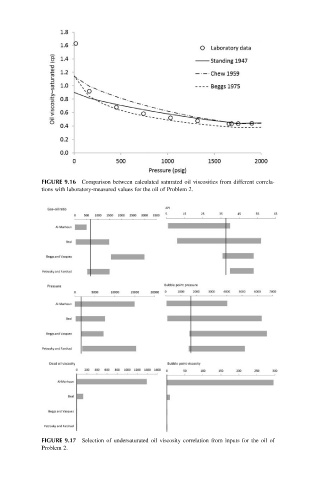
FIGURE 9.16 Comparison between calculated saturated oil viscosities from different correla-
            tions with laboratory-measured values for the oil of Problem 2.


            FIGURE 9.17 Selection of undersaturated oil viscosity correlation from inputs for the oil of
            Problem 2.