
Page 255 - PVT Property Correlations
P. 255
224 PVT Property Correlations
Conference and Exhibition, 3-6 October, Houston, Texas. Available from: https://doi.org/
10.2118/26668-MS.
Selim, A.M., 2018. Development of application maps for PVT Properties Correlations as
Guidelines for Correlations Selection (MS thesis). Cairo University, Cairo, Egypt.
Standing, M.B., 1947. A Pressure-Volume-Temperature Correlation for Mixtures of California
Oils and Gases. Drilling and Production Practice. American Petroleum Institute, New York,
United States, 1st January.
Vasquez, M., Beggs, H.D., 1980. Correlation for fluid physical property predictions. JPT 32,
968 970.
Velarde, J., Blasingame, T.A., and McCain, W.D., Jr., 1997. Correlation of black oil properties
at pressures below bubble point pressure - a new approach. In Paper PETSOC-97-93
Presented at the Petroleum Society of Canada Annual Technical Meeting, 8-11 June,
Calgary, Alberta, Canada. Available from: https://doi:10.2118/97-93.
PROBLEMS
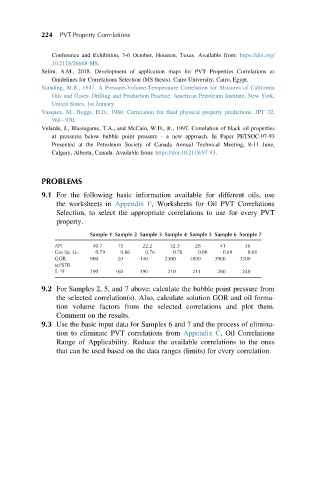
9.1 For the following basic information available for different oils, use
the worksheets in Appendix F, Worksheets for Oil PVT Correlations
Selection, to select the appropriate correlations to use for every PVT
property.
Sample 1 Sample 2 Sample 3 Sample 4 Sample 5 Sample 6 Sample 7
API 40.7 15 22.2 32.3 28 41 36
Gas Sp. Gr. 0.79 0.86 0.76 0.78 0.88 0.89 0.81
GOR, 900 20 140 2300 1800 3900 3300
scf/STB
T, F 190 160 190 210 211 280 240
9.2 For Samples 2, 5, and 7 above; calculate the bubble point pressure from
the selected correlation(s). Also, calculate solution GOR and oil forma-
tion volume factors from the selected correlations and plot them.
Comment on the results.
9.3 Use the basic input data for Samples 6 and 7 and the process of elimina-
tion to eliminate PVT correlations from Appendix C, Oil Correlations
Range of Applicability. Reduce the available correlations to the ones
that can be used based on the data ranges (limits) for every correlation.