
Page 246 - PVT Property Correlations
P. 246
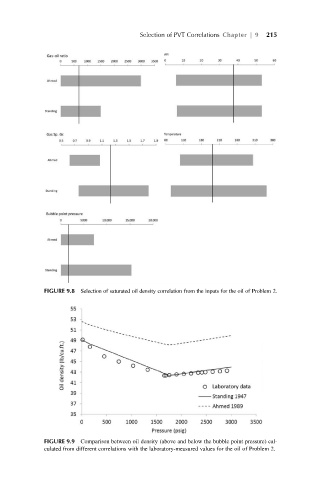
Selection of PVT Correlations Chapter | 9  215


             FIGURE 9.8 Selection of saturated oil density correlation from the inputs for the oil of Problem 2.


             FIGURE 9.9 Comparison between oil density (above and below the bubble point pressure) cal-
             culated from different correlations with the laboratory-measured values for the oil of Problem 2.