
Page 238 - PVT Property Correlations
P. 238
208 PVT Property Correlations
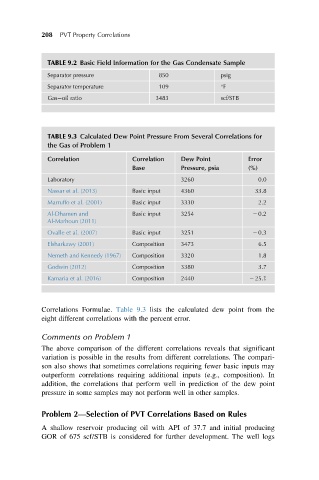
TABLE 9.2 Basic Field Information for the Gas Condensate Sample
Separator pressure 850 psig
Separator temperature 109 F
Gas oil ratio 3483 scf/STB
TABLE 9.3 Calculated Dew Point Pressure From Several Correlations for
the Gas of Problem 1
Correlation Correlation Dew Point Error
Base Pressure, psia (%)
Laboratory 3260 0.0
Nassar et al. (2013) Basic input 4360 33.8
Marruffo et al. (2001) Basic input 3330 2.2
Al-Dhamen and Basic input 3254 2 0.2
Al-Marhoun (2011)
Ovalle et al. (2007) Basic input 3251 2 0.3
Elsharkawy (2001) Composition 3473 6.5
Nemeth and Kennedy (1967) Composition 3320 1.8
Godwin (2012) Composition 3380 3.7
Kamaria et al. (2016) Composition 2440 2 25.1
Correlations Formulae. Table 9.3 lists the calculated dew point from the
eight different correlations with the percent error.
Comments on Problem 1
The above comparison of the different correlations reveals that significant
variation is possible in the results from different correlations. The compari-
son also shows that sometimes correlations requiring fewer basic inputs may
outperform correlations requiring additional inputs (e.g., composition). In
addition, the correlations that perform well in prediction of the dew point
pressure in some samples may not perform well in other samples.
Problem 2—Selection of PVT Correlations Based on Rules
A shallow reservoir producing oil with API of 37.7 and initial producing
GOR of 675 scf/STB is considered for further development. The well logs