
Page 34 - PVT Property Correlations
P. 34
Reservoir-Fluid Classification Chapter | 2 15
PRACTICAL CLASSIFICATION OF GASES
Gases exit in reservoirs whose temperatures are higher than the critical fluid
temperature. They exhibit dew point pressure at reservoir temperature.
Following McCain (1994b), gases can be divided into dry gases, wet gases,
and gas condensates. This classification of natural gases is based on practical
engineering considerations. The classification should provide guidelines to
engineers as to how to derive PVT properties and what equations and models
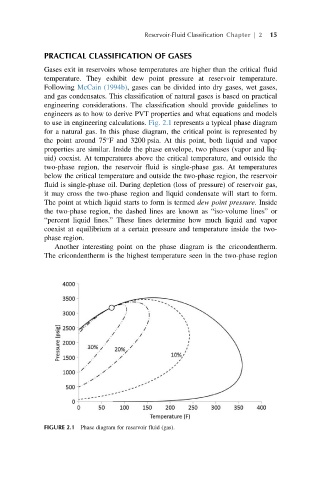
to use in engineering calculations. Fig. 2.1 represents a typical phase diagram
for a natural gas. In this phase diagram, the critical point is represented by
the point around 75 F and 3200 psia. At this point, both liquid and vapor
properties are similar. Inside the phase envelope, two phases (vapor and liq-
uid) coexist. At temperatures above the critical temperature, and outside the
two-phase region, the reservoir fluid is single-phase gas. At temperatures
below the critical temperature and outside the two-phase region, the reservoir
fluid is single-phase oil. During depletion (loss of pressure) of reservoir gas,
it may cross the two-phase region and liquid condensate will start to form.
The point at which liquid starts to form is termed dew point pressure. Inside
the two-phase region, the dashed lines are known as “iso-volume lines” or
“percent liquid lines.” These lines determine how much liquid and vapor
coexist at equilibrium at a certain pressure and temperature inside the two-
phase region.
Another interesting point on the phase diagram is the cricondentherm.
The cricondentherm is the highest temperature seen in the two-phase region
FIGURE 2.1 Phase diagram for reservoir fluid (gas).