
Page 38 - PVT Property Correlations
P. 38
Reservoir-Fluid Classification Chapter | 2 19
FIGURE 2.5 Phase diagram for an oil fluid.
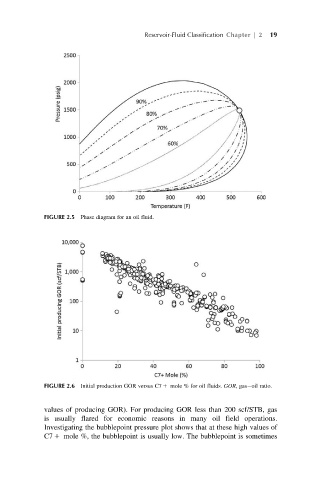
FIGURE 2.6 Initial production GOR versus C7 1 mole % for oil fluids. GOR, gas oil ratio.
values of producing GOR). For producing GOR less than 200 scf/STB, gas
is usually flared for economic reasons in many oil field operations.
Investigating the bubblepoint pressure plot shows that at these high values of
C7 1 mole %, the bubblepoint is usually low. The bubblepoint is sometimes