
Page 37 - PVT Property Correlations
P. 37
18 PVT Property Correlations
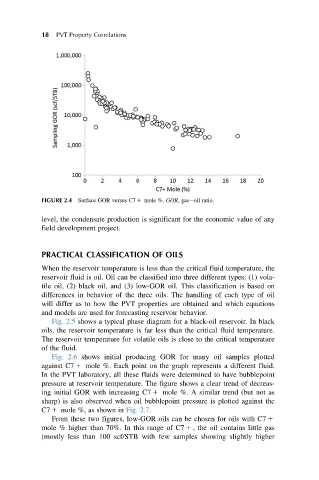
FIGURE 2.4 Surface GOR versus C7 1 mole %. GOR, gas oil ratio.
level, the condensate production is significant for the economic value of any
field development project.
PRACTICAL CLASSIFICATION OF OILS
When the reservoir temperature is less than the critical fluid temperature, the
reservoir fluid is oil. Oil can be classified into three different types: (1) vola-
tile oil, (2) black oil, and (3) low-GOR oil. This classification is based on
differences in behavior of the three oils. The handling of each type of oil
will differ as to how the PVT properties are obtained and which equations
and models are used for forecasting reservoir behavior.
Fig. 2.5 shows a typical phase diagram for a black-oil reservoir. In black
oils, the reservoir temperature is far less than the critical fluid temperature.
The reservoir temperature for volatile oils is close to the critical temperature
of the fluid.
Fig. 2.6 shows initial producing GOR for many oil samples plotted
against C7 1 mole %. Each point on the graph represents a different fluid.
In the PVT laboratory, all these fluids were determined to have bubblepoint
pressure at reservoir temperature. The figure shows a clear trend of decreas-
ing initial GOR with increasing C7 1 mole %. A similar trend (but not as
sharp) is also observed when oil bubblepoint pressure is plotted against the
C7 1 mole %, as shown in Fig. 2.7.
From these two figures, low-GOR oils can be chosen for oils with C7 1
mole % higher than 70%. In this range of C7 1 , the oil contains little gas
(mostly less than 100 scf/STB with few samples showing slightly higher