
Page 39 - PVT Property Correlations
P. 39
20 PVT Property Correlations
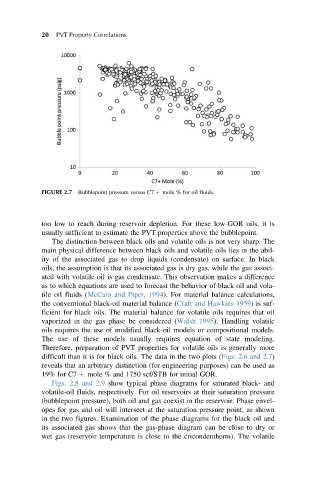
FIGURE 2.7 Bubblepoint pressure versus C7 1 mole % for oil fluids.
too low to reach during reservoir depletion. For these low-GOR oils, it is
usually sufficient to estimate the PVT properties above the bubblepoint.
The distinction between black oils and volatile oils is not very sharp. The
main physical difference between black oils and volatile oils lies in the abil-
ity of the associated gas to drop liquids (condensate) on surface. In black
oils, the assumption is that its associated gas is dry gas, while the gas associ-
ated with volatile oil is gas condensate. This observation makes a difference
as to which equations are used to forecast the behavior of black oil and vola-
tile oil fluids (McCain and Piper, 1994). For material balance calculations,
the conventional black-oil material balance (Craft and Hawkins 1959) is suf-
ficient for black oils. The material balance for volatile oils requires that oil
vaporized in the gas phase be considered (Walsh 1995). Handling volatile
oils requires the use of modified black-oil models or compositional models.
The use of these models usually requires equation of state modeling.
Therefore, preparation of PVT properties for volatile oils is generally more
difficult than it is for black oils. The data in the two plots (Figs. 2.6 and 2.7)
reveals that an arbitrary distinction (for engineering purposes) can be used as
19% for C7 1 mole % and 1750 scf/STB for initial GOR.
Figs. 2.8 and 2.9 show typical phase diagrams for saturated black- and
volatile-oil fluids, respectively. For oil reservoirs at their saturation pressure
(bubblepoint pressure), both oil and gas coexist in the reservoir. Phase envel-
opes for gas and oil will intersect at the saturation pressure point, as shown
in the two figures. Examination of the phase diagrams for the black oil and
its associated gas shows that the gas-phase diagram can be close to dry or
wet gas (reservoir temperature is close to the cricondentherm). The volatile