
Page 49 - PVT Property Correlations
P. 49
Chapter 3
Dry Gases
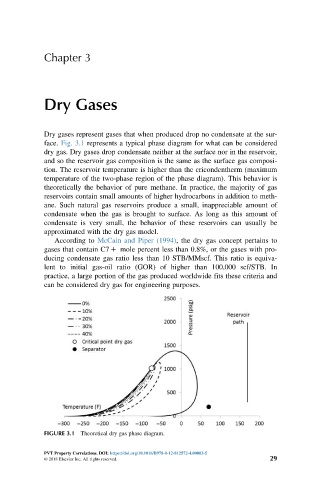
Dry gases represent gases that when produced drop no condensate at the sur-
face. Fig. 3.1 represents a typical phase diagram for what can be considered
dry gas. Dry gases drop condensate neither at the surface nor in the reservoir,
and so the reservoir gas composition is the same as the surface gas composi-
tion. The reservoir temperature is higher than the cricondentherm (maximum
temperature of the two-phase region of the phase diagram). This behavior is
theoretically the behavior of pure methane. In practice, the majority of gas
reservoirs contain small amounts of higher hydrocarbons in addition to meth-
ane. Such natural gas reservoirs produce a small, inappreciable amount of
condensate when the gas is brought to surface. As long as this amount of
condensate is very small, the behavior of these reservoirs can usually be
approximated with the dry gas model.
According to McCain and Piper (1994), the dry gas concept pertains to
gases that contain C7 1 mole percent less than 0.8%, or the gases with pro-
ducing condensate gas ratio less than 10 STB/MMscf. This ratio is equiva-
lent to initial gas-oil ratio (GOR) of higher than 100,000 scf/STB. In
practice, a large portion of the gas produced worldwide fits these criteria and
can be considered dry gas for engineering purposes.
FIGURE 3.1 Theoretical dry gas phase diagram.
PVT Property Correlations. DOI: https://doi.org/10.1016/B978-0-12-812572-4.00003-5
© 2018 Elsevier Inc. All rights reserved. 29