
Page 313 - Packed bed columns for absorption, desorption, rectification and direct heat transfer
P. 313
299
Fr = —
g «/*£
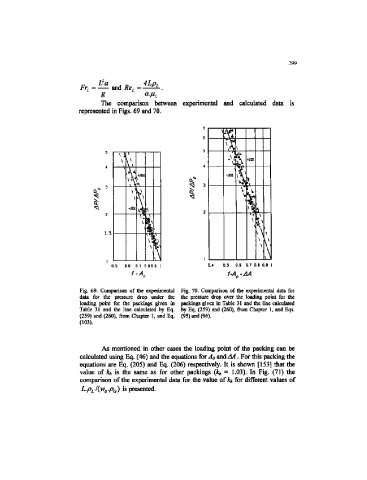
The comparison between experimental and calculated data is
represented in Figs. 69 and 70.
s
\ i \ A
\ V s. +7ITC
•V ma
\ *!
\' V" L V
V \. ^»
-202
\ * V+"
\
\
1.5 \ \ \
k \ \
Q.5 0.6 0.7 D.BO.a I Q.4 D.S 0.B D.7 Q.8 0.3 1
f-A.
Fig. 69. Comparison of the experimental Fig. 70. Comparison of the experimental data for
data for the pressure drop under the the pressure drop over the loading point for the
loading point for the packings given in packings given in Table 31 and the line calculated
Table 31 and the line calculated by Eq. by Eq. (259) and (260), from Chapter 1, and Eqs.
(259) and (260), from Chapter 1, and Eq. (95) and (96).
(103).
As mentioned in other cases the loading point of the packing can be
calculated using Eq. (46) and the equations for A o wa&AA. For this packing the
equations are Eq, (205) and Eq. (206) respectively. It is shown [153] that the
value of kf, is the same as for other packings (j% = 1.03). In Fig. (71) the
comparison of the experimental date for the value of A* for different values of
L.pj^/lWg.pg) is presented.