
Page 189 - Partition & Adsorption of Organic Contaminants in Environmental Systems
P. 189
180 CONTAMINANT SORPTION TO SOILS AND NATURAL SOLIDS
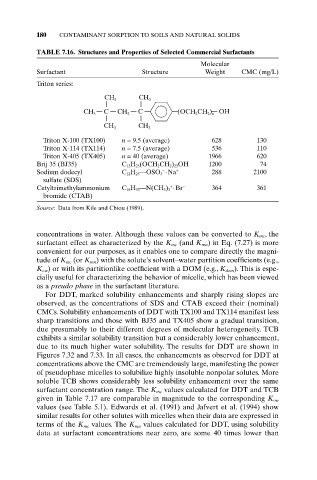
TABLE 7.16. Structures and Properties of Selected Commercial Surfactants
Molecular
Surfactant Structure Weight CMC (mg/L)
Triton series:
CH 3 CH 3
CH 3 C CH 2 C (OCH CH ) OH
2
2 n
CH
CH 3 3
Triton X-100 (TX100) n = 9.5 (average) 628 130
Triton X-114 (TX114) n = 7.5 (average) 536 110
Triton X-405 (TX405) n = 40 (average) 1966 620
Brij 35 (BJ35) C 12H 25(OCH 2CH 2) 23OH 1200 74
-
Sodium dodecyl C 12H 25—OSO 3 ◊Na + 288 2100
sulfate (SDS)
+
Cetyltrimethylammonium C 16H 33—N(CH 3) 3 ◊Br - 364 361
bromide (CTAB)
Source: Data from Kile and Chiou (1989).
concentrations in water. Although these values can be converted to K mc,the
surfactant effect as characterized by the K mc (and K mn) in Eq. (7.27) is more
convenient for our purposes, as it enables one to compare directly the magni-
tude of K mc (or K mn) with the solute’s solvent–water partition coefficients (e.g.,
K ow) or with its partitionlike coefficient with a DOM (e.g., K dom). This is espe-
cially useful for characterizing the behavior of micelle, which has been viewed
as a pseudo phase in the surfactant literature.
For DDT, marked solubility enhancements and sharply rising slopes are
observed, as the concentrations of SDS and CTAB exceed their (nominal)
CMCs. Solubility enhancements of DDT with TX100 and TX114 manifest less
sharp transitions and those with BJ35 and TX405 show a gradual transition,
due presumably to their different degrees of molecular heterogeneity. TCB
exhibits a similar solubility transition but a considerably lower enhancement,
due to its much higher water solubility. The results for DDT are shown in
Figures 7.32 and 7.33. In all cases, the enhancements as observed for DDT at
concentrations above the CMC are tremendously large, manifesting the power
of pseudophase micelles to solubilize highly insoluble nonpolar solutes. More
soluble TCB shows considerably less solubility enhancement over the same
surfactant concentration range. The K mc values calculated for DDT and TCB
given in Table 7.17 are comparable in magnitude to the corresponding K ow
values (see Table 5.1). Edwards et al. (1991) and Jafvert et al. (1994) show
similar results for other solutes with micelles when their data are expressed in
terms of the K mc values. The K mn values calculated for DDT, using solubility
data at surfactant concentrations near zero, are some 40 times lower than