
Page 236 - Partition & Adsorption of Organic Contaminants in Environmental Systems
P. 236
UPTAKE BY ROOT CROPS FROM DIFFERENT SOILS 227
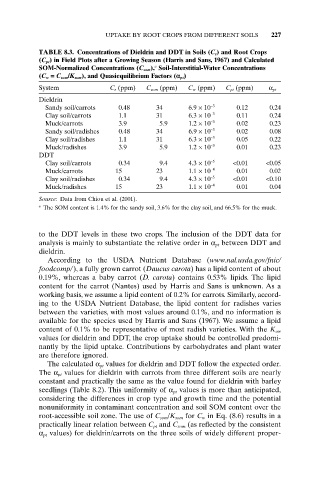
TABLE 8.3. Concentrations of Dieldrin and DDT in Soils (C s) and Root Crops
(C pt) in Field Plots after a Growing Season (Harris and Sans, 1967) and Calculated
a
SOM-Normalized Concentrations (C som), Soil-Interstitial-Water Concentrations
(C w = C som/K som), and Quasiequilibrium Factors (a pt)
System C s (ppm) C som (ppm) C w (ppm) C pt (ppm) a pt
Dieldrin
Sandy soil/carrots 0.48 34 6.9 ¥ 10 -3 0.12 0.24
Clay soil/carrots 1.1 31 6.3 ¥ 10 -3 0.11 0.24
Muck/carrots 3.9 5.9 1.2 ¥ 10 -3 0.02 0.23
Sandy soil/radishes 0.48 34 6.9 ¥ 10 -3 0.02 0.08
Clay soil/radishes 1.1 31 6.3 ¥ 10 -3 0.05 0.22
Muck/radishes 3.9 5.9 1.2 ¥ 10 -3 0.01 0.23
DDT
Clay soil/carrots 0.34 9.4 4.3 ¥ 10 -5 <0.01 <0.05
Muck/carrots 15 23 1.1 ¥ 10 -4 0.01 0.02
Clay soil/radishes 0.34 9.4 4.3 ¥ 10 -5 <0.01 <0.10
Muck/radishes 15 23 1.1 ¥ 10 -4 0.01 0.04
Source: Data from Chiou et al. (2001).
a The SOM content is 1.4% for the sandy soil, 3.6% for the clay soil, and 66.5% for the muck.
to the DDT levels in these two crops. The inclusion of the DDT data for
analysis is mainly to substantiate the relative order in a pt between DDT and
dieldrin.
According to the USDA Nutrient Database (www.nal.usda.gov/fnic/
foodcomp/), a fully grown carrot (Daucus carota) has a lipid content of about
0.19%, whereas a baby carrot (D. carota) contains 0.53% lipids. The lipid
content for the carrot (Nantes) used by Harris and Sans is unknown. As a
working basis, we assume a lipid content of 0.2% for carrots. Similarly, accord-
ing to the USDA Nutrient Database, the lipid content for radishes varies
between the varieties, with most values around 0.1%, and no information is
available for the species used by Harris and Sans (1967). We assume a lipid
content of 0.1% to be representative of most radish varieties. With the K ow
values for dieldrin and DDT, the crop uptake should be controlled predomi-
nantly by the lipid uptake. Contributions by carbohydrates and plant water
are therefore ignored.
The calculated a pt values for dieldrin and DDT follow the expected order.
The a pt values for dieldrin with carrots from three different soils are nearly
constant and practically the same as the value found for dieldrin with barley
seedlings (Table 8.2). This uniformity of a pt values is more than anticipated,
considering the differences in crop type and growth time and the potential
nonuniformity in contaminant concentration and soil SOM content over the
root-accessible soil zone. The use of C som/K som for C w in Eq. (8.6) results in a
practically linear relation between C pt and C som (as reflected by the consistent
a pt values) for dieldrin/carrots on the three soils of widely different proper-