
Page 164 - Percolation Models for Transport in Porous Media With
P. 164
9.2 PORE SPACE STRUCTURE 161
structure of a medium characterized by a radius probability density function for
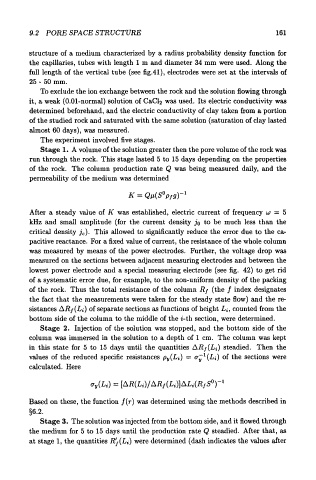
the capillaries, tubes with length 1 m and diameter 34 mm were used. Along the
full length of the vertical tube (see fig.41), electrodes were set at the intervals of
25-50 mm.
To exclude the ion exchange between the rock and the solution flowing through
it, a weak (0.01-normal) solution of CaC12 was used. Its electric conductivity was
determined beforehand, and the electric conductivity of clay taken from a portion
of the studied rock and saturated with the same solution (saturation of clay lasted
almost 60 days), was measured.
The experiment involved five stages.
Stage 1. A volume of the solution greater then the pore volume of the rock was
run through the rock. This stage lasted 5 to 15 days depending on the properties
of the rock. The column production rate Q was being measured daily, and the
permeability of the medium was determined
After a steady value of K was established, electric current of frequency w = 5
kHz and small amplitude (for the current density jo to be much less than the
critical density ic)· This allowed to significantly reduce the error due to the ca-
pacitive reactance. For a fixed value of current, the resistance of the whole column
was measured by means of the power electrodes. Further, the voltage drop was
measured on the sections between adjacent measuring electrodes and between the
lowest power electrode and a special measuring electrode (see fig. 42) to get rid
of a systematic error due, for example, to the non-uniform density of the packing
of the rock. Thus the total resistance of the column R1 (the f index designates
the fact that the measurements were taken for the steady state flow) and the re-
sistances llRt(Li) of separate sections as functions of height Li, counted from the
bottom side of the column to the middle of the i-th section, were determined.
Stage 2. Injection of the solution was stopped, and the bottom side of the
column was immersed in the solution to a depth of 1 em. The column was kept
in this state for 5 to 15 days until the quantities tlRJ(Li} steadied. Then the
values of the reduced specific resistances Py(Li) = a;; 1 (Li) of the sections were
calculated. Here
Based on these, the function f(r) was determined using the methods described in
§6.2.
Stage 3. The solution was injected from the bottom side, and it flowed through
the medium for 5 to 15 days until the production rate Q steadied. After that, as
at stage 1, the quantities R/(Li) were determined (dash indicates the values after