
Page 166 - Percolation Models for Transport in Porous Media With
P. 166
9.2 PORE SPACE STRUCTURE 163
I
l•
,. • .,
,..
11
II
II
II
•
II
I
II
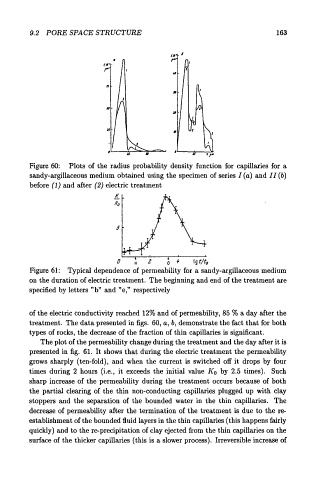
Figure 60: Plots of the radius probability density function for capillaries for a
sandy-argillaceous medium obtained using the specimen of series I (a) and II (b)
before (1) and after (2) electric treatment
K
Ho
D +
H tgtjt 0
Figure 61: Typical dependence of permeability for a sandy-argillaceous medium
on the duration of electric treatment. The beginning and end of the treatment are
specified by letters "b" and "e," respectively
of the electric conductivity reached 12% and of permeability, 85 % a day after the
treatment. The data presented in figs. 60, a, b, demonstrate the fact that for both
types of rocks, the decrease of the fraction of thin capillaries is significant.
The plot of the permeability change during the treatment and the day after it is
presented in fig. 61. It shows that during the electric treatment the permeability
grows sharply (ten-fold}, and when the current is switched off it drops by four
times during 2 hours (i.e., it exceeds the initial value K 0 by 2.5 times). Such
sharp increase of the permeability during the treatment occurs because of both
the partial clearing of the thin non-conducting capillaries plugged up with clay
stoppers and the separation of the bounded water in the thin capillaries. The
decrease of permeability after the termination of the treatment is due to the re-
establishment of the bounded fluid layers in the thin capillaries (this happens fairly
quickly} and to there-precipitation of clay ejected from the thin capillaries on the
surface of the thicker capillaries (this is a slower process). Irreversible increase of