
Page 165 - Percolation Models for Transport in Porous Media With
P. 165
162 CHAPTER 9 ELECTRIC ACTION EFFECT. EXPERIMENT
• 1
~>2
"
IQ
5
•
A A &
····~·······~
0 42 4+ 46 IJ,I 1.,"
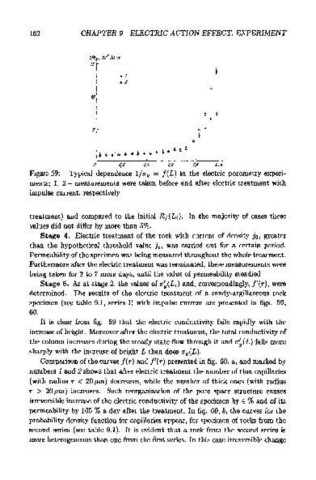
Figure 59: Typical dependence 1/ u y = f ( L) in the electric porometry experi-
ments; 1, 2- measurements were taken before and after electric treatment with
impulse current, respectively
treatment) and compared to the initial RJ(Li)· In the majority of cases these
values did not differ by more than 5%.
Stage 4. Electric treatment of the rock with current of density j 0 , greater
than the hypothetical threshold value ic, was carried out for a certain period.
Permeability of the specimen was being measured throughout the whole treatment.
Furthermore after the electric treatment was terminated, these measurements were
being taken for 2 to 7 more days, until the value of permeability steadied.
Stage 5. As at stage 2, the values of u~(Li) and, correspondingly, f'(r), were
determined. The results of the electric treatment of a sandy-argillaceous rock
specimen (see table 9.1, series I) with impulse current are presented in figs. 59,
60.
It is clear from fig. 59 that the electric conductivity falls rapidly with the
increase of height. Moreover after the electric treatment, the total conductivity of
the column increases during the steady state flow through it and u~(L) falls more
sharply with the increase of height L than does uy(L).
Comparison of the curves f(r) and /'(r) presented in fig. 60, a, and marked by
numbers 1 and 2 shows that after electric treatment the number of thin capillaries
(with radius r < 20 J.tm) decreases, while the number of thick ones (with radius
r > 20 J.tm) increases. Such reorganization of the pore space structure causes
irreversible increase of the electric conductivity of the specimen by 4 % and of its
permeability by 105 % a day after the treatment. In fig. 60, b, the curves for the
probability density function for capillaries appear, for specimen of rocks from the
second series (see table 9.1). It is evident that a rock from the second series is
more heterogeneous than one from the first series. In this case irreversible change