
Page 191 - Petroleum Geology
P. 191
168
Darcy's law has an upper limit, but this is rarely (if ever) exceeded in nature.
No lower limit has been demonstrated. The intrinsic permeability of VYCOR,
mentioned above, is of the order of cm2, or lo-' darcies.
For any porous and permeable material, the intrinsic permeability can be
determined experimentally using any liquid - for example, oil or water:
k = qwqwl/PwgAhw = qoV01/p&Aho. (8.9)
When both liquids are present as two immiscible phases in the pore spaces,
we can determine the permeability of the material to oil and the permeability
to water. These are known as effective permeabilities - the effective perme-
ability to oil (k,) or gas (kg) and the effective permeability to water (kw).
Clearly these quantities are functions of water saturation: the greater the
water saturation, the greater the effective permeability to water and the smaller
the effective permeability to oil (or gas). But at 100% and zero water satura-
tions, the effective permeability is equal to the intrinsic permeability, so it is
convenient to express these as relative permeability: krw = kw/k, k,, = ko/k,
and krg = kg/k. Effective permeability is in the nature of an intrinsic perme-
ability because each fluid reduces the effective porosity for the other and each
affects the tortuosity of the flow path of the other.
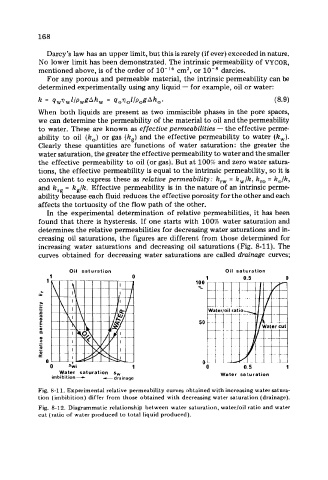
In the experimental determination of relative permeabilities, it has been
found that there is hysteresis. If one starts with 100% water saturation and
determines the relative permeabilities for decreasing water saturations and in-
creasing oil saturations, the figures are different from those determined for
increasing water saturations and decreasing oil saturations (Fig. 8-1 1). The
curves obtained for decreasing water saturations are called drainage curves;
Oil saturation Oil saturation
1 n 1 0.5 0
1 100
%
L
-k
50
0 a
1 0 0.5 1
Water saturation sw Water saturation
irnbibition- -drainage
Fig. 8-1 1. Experimental relative permeability curves obtained with increasing water satura-
tion (imbibition) differ from those obtained with decreasing water saturation (drainage).
Fig. 8-12. Diagrammatic relationship between water saturation, waterloil ratio and water
cut (ratio of water produced to total liquid produced).