
Page 113 - Petroleum and Gas Field Processing
P. 113
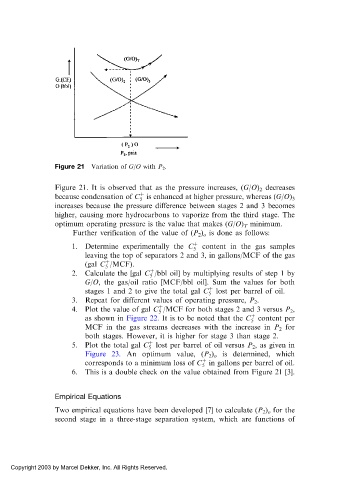
Figure 21 Variation of G/O with P 2 .

            Figure 21. It is observed that as the pressure increases, (G/O) 2 decreases
                                   þ
                                   5
            because condensation of C is enhanced at higher pressure, whereas (G/O) 3
            increases because the pressure difference between stages 2 and 3 becomes
            higher, causing more hydrocarbons to vaporize from the third stage. The
            optimum operating pressure is the value that makes (G/O) T minimum.
                 Further verification of the value of (P 2 ) o is done as follows:
                 1. Determine experimentally the C þ  content in the gas samples
                                                 5
                    leaving the top of separators 2 and 3, in gallons/MCF of the gas
                          þ
                    (gal C /MCF).
                          5
                                      þ
                 2. Calculate the [gal C /bbl oil] by multiplying results of step 1 by
                                      5
                    G/O, the gas/oil ratio [MCF/bbl oil]. Sum the values for both
                    stages 1 and 2 to give the total gal C þ  lost per barrel of oil.
                                                     5
                 3. Repeat for different values of operating pressure, P 2 .
                                        þ
                 4. Plot the value of gal C /MCF for both stages 2 and 3 versus P 2 ,
                                        5
                                                                 þ
                    as shown in Figure 22. It is to be noted that the C content per
                                                                 5
                    MCF in the gas streams decreases with the increase in P 2 for
                    both stages. However, it is higher for stage 3 than stage 2.
                                     þ
                 5. Plot the total gal C lost per barrel of oil versus P 2 , as given in
                                     5
                    Figure 23. An optimum value, (P 2 ) o is determined, which
                                                    þ
                    corresponds to a minimum loss of C in gallons per barrel of oil.
                                                    5
                 6. This is a double check on the value obtained from Figure 21 [3].
            Empirical Equations
            Two empirical equations have been developed [7] to calculate (P 2 ) o for the
            second stage in a three-stage separation system, which are functions of


 Copyright 2003 by Marcel Dekker, Inc. All Rights Reserved.