
Page 112 - Petroleum and Gas Field Processing
P. 112
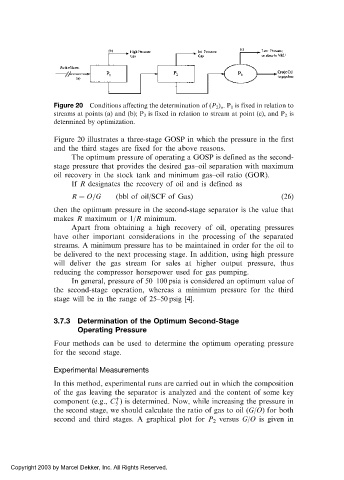
Figure 20  Conditions affecting the determination of (P 2 ) o .P 1 is fixed in relation to
            streams at points (a) and (b); P 3 is fixed in relation to stream at point (c), and P 2 is
            determined by optimization.

            Figure 20 illustrates a three-stage GOSP in which the pressure in the first
            and the third stages are fixed for the above reasons.
                 The optimum pressure of operating a GOSP is defined as the second-
            stage pressure that provides the desired gas–oil separation with maximum
            oil recovery in the stock tank and minimum gas–oil ratio (GOR).
                 If R designates the recovery of oil and is defined as

                 R ¼ O=G     ðbbl of oil/SCF of Gas)                     ð26Þ
            then the optimum pressure in the second-stage separator is the value that
            makes R maximum or 1/R minimum.
                 Apart from obtaining a high recovery of oil, operating pressures
            have other important considerations in the processing of the separated
            streams. A minimum pressure has to be maintained in order for the oil to
            be delivered to the next processing stage. In addition, using high pressure
            will deliver the gas stream for sales at higher output pressure, thus
            reducing the compressor horsepower used for gas pumping.
                 In general, pressure of 50–100 psia is considered an optimum value of
            the second-stage operation, whereas a minimum pressure for the third
            stage will be in the range of 25–50 psig [4].

            3.7.3  Determination of the Optimum Second-Stage
                  Operating Pressure
            Four methods can be used to determine the optimum operating pressure
            for the second stage.

            Experimental Measurements
            In this method, experimental runs are carried out in which the composition
            of the gas leaving the separator is analyzed and the content of some key
                            þ
            component (e.g., C ) is determined. Now, while increasing the pressure in
                            5
            the second stage, we should calculate the ratio of gas to oil (G/O) for both
            second and third stages. A graphical plot for P 2 versus G/O is given in


 Copyright 2003 by Marcel Dekker, Inc. All Rights Reserved.