
Page 66 - Petrology of Sedimentary Rocks
P. 66
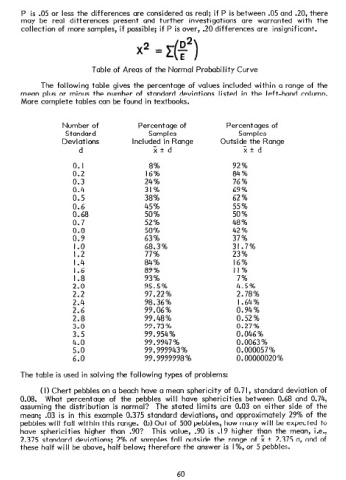
P  is  .05  or  less  the  differences   are  considered   as  real;   if  P  is  between   .05  and  .20,  there
        may   be  real   differences   present   and   further   investigations   are   warranted   with   the
        collection   of  more   samples,   if  possible;   if  P  is  over,   . 20  differences   are   insignificant.

                                           X2  =


                             Table   of  Areas   of  the  Normal   Probability   Curve

              The   following   table   gives   the  percentage   of  values   included   within   a  range   of  the
        mean   plus  or  minus   the  number   of  standard   deviations   listed   in  the   left-hand   column.
        More   complete   tables   can  be  found   in  textbooks.


                    Number   of            Percentage   of            Percentages   of
                     Standard                  Samples                    Samples
                    Deviations            Included   in  Range       Outside   the  Range
                         d                      X+  d                       X+  d

                        0.  I                  8%                       92%
                       0.2                    16%                       84%
                       0.3                   24%                        76%
                       0.4                   31%                        69%
                       0.5                   38%                        62%
                       0.6                   45%                        55%
                       0.68                  50%                        50%
                                             52%                        48%
                       El  0:9               58%                        42%
                                             63%                        37%
                        1.0                  68.3%                      31.7%
                                             77%                        23%
                        1*2                  84%                         16%
                        I:6                  89%                         II%
                                             93%                           OO
                       E  2:2                95.5%                       25%
                                             97.22%                      2.78%
                                             98.36%                       I .64%
                       2:8
                       ?Z                    99.06%                      0.94%
                                             99.48%                      0.52%
                       3.0                   99.73%                      0.27%
                       3.5                   99.954%                     0.046%
                       4.0                   99.9947%                    0.0063%
                       5.0                   99.999943%                  0.000057%
                       6.0                   99.9999998%                 0.00000020%

       The  table   is  used  in  solving   the  following   types   of  problems:

              (I)  Chert   pebbles   on  a  beach   have   a  mean   sphericity   of  0.7  I,  standard   deviation   of
       0.08.   What   percentage   of  the   pebbles   will   have   sphericities   between   0.68  and  0.74,
       assuming   the  distribution   is  normal.  3   The   stated   limits   are   0.03   on  either   side  of  the
       mean;   .03  is  in  this   example   0.375   standard   deviations,   and  approximately   29%  of  the
       pebbles   will   fall   within   this  range.   (b)  Out  of  500  pebbles,   how  many   will   be  expected   to
       have   sphericities   higher   than   .YO?   This   value,   .YO  is  .I  9  higher   than   the  mean,   i.e.,
       2.375   standard   deviations;   2%  of  samples   fall   outside   the  range   of  X  +-  2.375  a,  and  of
       these   half   will   be  above,   half   below;   therefore   the  answer   is  I%,  or  5  pebbles.


                                                       60