Page 65 - Petrology of Sedimentary Rocks
P. 65

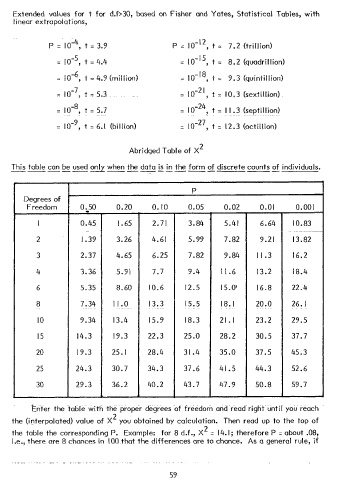
Extended   values   for   t  for   d.f>30,   based   on  Fisher   and  Yates,   Statistical   Tables,   with
     linear   extrapolations,


                P  =  lo-4,   t  =  3.9               P  =  10-12  ,  t  =  7.2   (trillion)

                  =  10-5,   t  =  4.4                  =  IO-15,   t  =  8.2   (quadrillion)

                  =  10-6  ,  t  =  4.9  (million)      =  10-18,   t  =  9.3   (quintillion)

                  =  10-7  ,  t  =  5.3                 =  10-21  ,  t  =  10.3   (sextillion)

                  =  10-8,   t  =  5.7                  =  10-24,   t  =  I  I .3  (septillion)

                        9
                  =   IO-  ,  t  =  6.1  (billion)      =  10-27  ,  t  =  12.3   (octillion)


                                        Abridged   Table   of  X2

                                                                             counts
                                  when
     This  table
    -----       can  be  used  only   --------   the  data   is  in  the  form   of  discrete   --   of  individuals.
         Freedom  F                                         P                                      1
        Degrees   of      0 .,50     0.20       0.  IO    0.05       0.02       0.01       0.001


             I            0.45       1.65       2.71       3.84       5.41      6.64       10.83

            2             1.39       3.26      4.61        5.99       7.82      9.21       13.82

            3             2.37       4.65       6.25       7.82       9.84     Il.3        16.2

            4             3.36       5.91       7.7       9.4       II.6       13.2        18.4

            6             5.35       8.60     10.6        12.5      15.0’      16.8       22.4

            8             7.34      Il.0       13.3       15.5      18.  I     20.0       26.1

             IO           9.34      13.4       15.9       18.3      21.1       23.2       29.5

             I5          14.3       19.3      22.3       25.0       28.2       30.5       37.7

            20           19.3      25.1       28.4       31.4       35.0       37.5       45.3

            25          24.3       30.7       34.3       37.6       41.5       44.3       52.6

            30          29.3       36.2       40.2       43.7       47.9       50.8       59.7


           Enter   the  table   with   the  proper   degrees   of  freedom   and  read   right   until   you  reach
     the  (interpolated)   value   of  X2  you  obtained   by  calculation.   Then   read   up  to  the  top  of

     the  table   the  corresponding   P.   Example:   for  8  d.f.,   X2  =  14.  I;  therefore   P  =  about   .08,
     i.e.,  there   are  8  chances   in  100  that   the  differences   are  to  chance.   As  a  general   rule,   if


                                                     59
   60   61   62   63   64   65   66   67   68   69   70