
Page 60 - Petrology of Sedimentary Rocks
P. 60
Comparison of two means. We have studied the heavy mineral suites of two formations.
We examine 50 samples of the Abner formation and find that within the heavy minerals,
of the garnet content averages 15.0% with a standard deviation of 5%; and 30 samples
of the Benjamin formation show a garnet content of 10.0 with a standard deviation of
4.0%. The question arises, does the Abner really have more garnet than the Benjamin,
or could such differences have arisen by chance sampling of a homogeneous population?
The so-called “t test” has been devised to answer this question and is one of the most
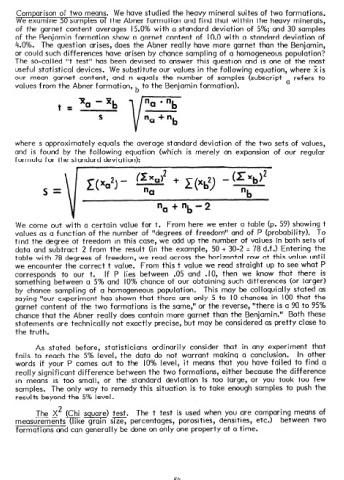
useful statistical devices. We substitute our values in the following equation, where ;;i: is
our mean garnet content, and n equals the number of samples (subscript a refers to
values from the Abner formation , b to the Benjamin formation).
where s approximately equals the average standard deviation of the two sets of values,
and is found by the following equation (which is merely an expansion of our regular
formula for the standard deviation):
We come out with a certain value for t. From here we enter a table (p. 59) showing t
values as a function of the number of “degrees of freedom” and of ? (probability). To
find the degree of freedom in this case, we add up the number of values in both sets of
data and subtract 2 from the result (in the example, 50 + 30-2 = 78 d.f.) Entering the
table with 78 degrees of freedom, we read across the horizontal row at this value until
we encounter the correct t value. From this t value we read straight up to see what P
corresponds to our t. If P lies between .05 and . IO, then we know that there is
something between a 5% and 10% chance of our obtaining such differences (or larger)
by chance sampling of a homogeneous population. This may be colloquially stated as
saying “our experiment has shown that there are only 5 to IO chances in 100 that the
garnet content of the two formations is the same,” or the reverse, “there is a 90 to 95%
chance that the Abner really does contain more garnet than the Benjamin.” Both these
statements are technically not exactly precise, but may be considered as pretty close to
the truth.
As stated before, statisticians ordinarily consider that in any experiment that
fails to reach the 5% level, the data do not warrant making a conclusion. In other
words if your P comes out to the 10% level, it means that you have failed to find a
really significant difference between the two formations, either because the difference
in means is too small, or the standard deviation is too large, or you took too few
samples. The only way to remedy this situation is to take enough samples to push the
results beyond the 5% level.
The
-- X2 (Chi square) test. The t test is used when you are comparing means of
measurementsme grain size, percentages, porosities, densities, etc.) between two
formations and can generally be done on only one property at a time.
54