
Page 57 - Petrology of Sedimentary Rocks
P. 57
Arithmetic Mean: The most common and useful type of average for ordinary
purposes is the arithmetic mean, symbolized X. To obtain this value, simply add up the
values and divide the result by the number (n) of values. This is symbolized as
There are a number of other averages (median, mode, geometric mean, etc.) which are
useful in special cases-- especially when the data is skewed, as when you are taking an
average consisting of a lot of small values and a few very large values, which would
tend to distort the simple arithmetic mean.
Standard Deviation: For most data we are interested in determining the spread or
scatter of the values. For example, a set of reading 4, 6, 7, 4, 5, 6, obviously is less
scattered than a set such as 2, 5, 14, I, 9, 3, al though both have the same mean. The
standard deviation (s or a) is a precise measure of this scatter and, next to the mean, is
the most useful value in statistics. It is the only measure of spread that has wide use.
The standard deviation is computed such that, on an average, 68% of the samples will
fall within plus or minus one standard deviation (+ a) from the mean; 95% will fall
within plus or minus two standard deviations (22~); and 99% of the samples will fall
within + 3a. For example, if we have 100 porosity values on a sandstone formation and
the mean porosity is 15.0% with a standard deviation of 3.0%, we know that
approximately 68 of these 100 samples will have porosities ranging between I2 and 18%
ti +a), that 95 samples will range between 9 and 21% (x +2a), and that 99 samples will
range between 6 and 24% (2 + 3a). Of course this assumes that we have a sufficient
number of values, and that the values follow the normal bell-shaped probability curve
(in which most of the values cluster about the mean, and “tail off” symmetrically to
each side). This is tacitly assumed for most statistical work. A complete table of the
percent of values included in a number of standard deviations is given on page 61.
To obtain the standard deviation there are two different methods which give
identical answers. In the long method, one finds the arithmetic mean of his values, then
finds the deviation of each value from this mean, and squares these deviations; then
adds up these squared values, divides by the number of values and takes the square root
of this quotient. In the short method, which we will use, one substitutes values in the
following formula:
n-l
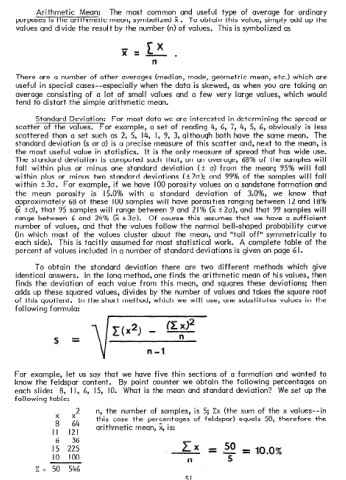
For example, let us say that we have five thin sections of a formation and wanted to
know the feldspar content. By point counter we obtain the following percentages on
each slide: 8, I I, 6, 15, IO. What is the mean and standard deviation? We set up the
following table:
2 n, the number of samples, is 5; Cx (the sum of the x values--in
this case the percentages of feldspar) equals 50, therefore the
;; ;4 arithmetic mean, X, is:
II I21
6 36
I5 225 z X =z = 10.0%
IO 100 n 5
c = 50 546
51