
Page 54 - Petrology of Sedimentary Rocks
P. 54
Measures of Skewness and Kurtosis
. / ‘--
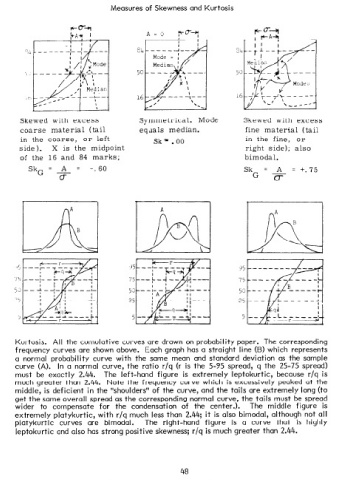
Skewed with excess Symmetrical. Mode Skewed with excess
coarse material (tail equals median. fine material (tail
in the coarse, or left Sk = .OO in the fine, or
side ). X is the midpoint right side); also
of the 16 and 84 marks; bimodal.
= A = -.60 Sk = A
SkG = +.75
o- G -XT--
l
--- - --_-
I
75 --f-d-- / 1’---
1 I I
53 - -/-,- f - *I--- -- + ’ B ----a
I I
25 -& ---+-- .- L------L
1 B I
d
; y-q-g i P-
5 -- &=,=+ 4. --- -L--,---I
w -r------4
Kurtosis. All the cumulative curves are drawn on probability paper. The corresponding
frequency curves are shown above. Each graph has a straight line (B) which represents
a normal probability curve with the same mean and standard deviation as the sample
curve (A). In a normal curve, the ratio r/q (r is the 5-95 spread, q the 25-75 spread)
must be exactly 2.44. The left-hand figure is extremely leptokurtic, because r/q is
much greater than 2.44. Note the frequency curve which is excessively peaked at the
middle, is deficient in the “shoulders” of the curve, and the tails are extremely long (to
get the same overall spread as the corresponding normal curve, the tails must be spread
wider to compensate for the condensation of the center.). The middle figure is
extremely platykurtic, with r/q much less than 2.44; it is also bimodal, although not all
platykurtic curves are bimodal. The right-hand figure is a curve that is highly
leptokurtic and also has strong positive skewness; r/q is much greater than 2.44.
48