Page 53 - Petrology of Sedimentary Rocks
P. 53

better   than   any  other   method   if  the  sediment   is  bimodal.   Or,  one  may  plot  as  a  contour
           map  the  diameter   of  the  largest   particle   in  the  sample.   Try  new  methods   all  the  time.


                               Measures   of  Average   Size  and  Standard   Deviation


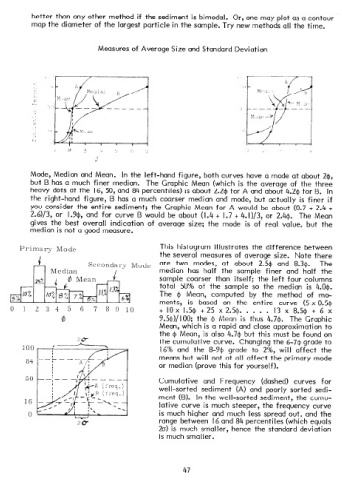
           Mode,   Median   and  Mean.   In  the  left-hand   figure,   both   curves   have   a  mode   at  about   2@,
          but  B  has  a  much   finer   median.   The  Graphic   Mean   (which   is  the  average   of  the  three
          heavy   dots  at  the   16,  50,  and  84  percentiles)   is  about   2.24  for  A  and  about   4.2~  for  B.  In
          the  right-hand   figure,   B  has  a  much   coarser   median   and  mode,   but  actually   is  finer   if
           you  consider   the  entire   sediment;   the  Graphic   Mean   for  A  would   be  about   (0.7  +  2.4  +
           2.6)/3,   or   I .Y$,  and  for   curve   B  would   be  about   (1.4  +  I .7  +  4.  I )/3,  or  2.4+.   The  Mean
          gives   the  best  overall   indication   of  average   size;   the   mode   is  of  real   value,   but   the
          median   is  not  a  good  measure.


       Primary    Mode                            This  histogram   illustrates   the  difference   between
             c              Secondary    Mode     the  several   modes,   at   of  average   size.   8.30.   there
                                                                                           Note
                                                              measures
                                                                                2.54
                                                                                      and
                                                                                                  The
                                                  are
                                                       two
                                                                         about
           r-l   Median             I             median   has  half   the   sample   finer   and   half   the
                                                  sample   coarser   than   itself;   the  left   four   columns
                                                  total   50%  of  the   sample   so  the   median   is  4.0$.
                                                  The   $I  Mean,   computed   by  the   method   of   mo-
                                                  ments,   is  based   on   the   entire   curve   (5  x  0.50
    0   1234          5   6   7   8  9   10       +  IO  x  l.5$   +  25  x  2.5~).  .  .  .  .  I3  x  8.54   +  6  x
                    0                             9.5@)/100;   the  4  Mean   is  thus  4.7+.   The  Graphic
                                                  Mean,   which   is  a  rapid   and  close  approximation   to
                                                  the  $  Mean,   is  also  4.74  but  this  must  be  found   on
                                                  the  cumulative   curve.   Changing   the  6-74,  grade   to
                                                  16%  and   the   8-Y@  grade   to  2%,  will   affect   the
                                                  means   but  will   not  at  all  affect   the  primary   mode
                                                  or  median   (prove   this  for  yourself).

                                                  Cumulative   and   Frequency   (dashed)   curves   for
                                                  well-sorted   sediment   (A)  and  poorly   sorted   sedi-
                                                  ment   (B).   In  the  well-sorted   sediment,   the  cumu-
         16                                       lative   curve   is  much   steeper,   the  frequency   curve
                                                  is  much   higher   and  much   less  spread   out,   and  the
                                                  range   between   I6  and  84  percentiles   (which   equals
                                                  2a)  is  much   smaller,   hence   the  standard   deviation
                                                  is  much  smaller.


                                                         47
   48   49   50   51   52   53   54   55   56   57   58