
Page 290 - Petrophysics 2E
P. 290
262 PETROPHYSICS: RESERVOIR ROCK PROPERTIES
0.016
-
0.012 -
5
\
2 0.008-
E
s
_--*
-- I 1 1 1 1 1 1 1
-0.05 0 0.05 0.0 0.15 0.20 0.25
C, , mho / cm
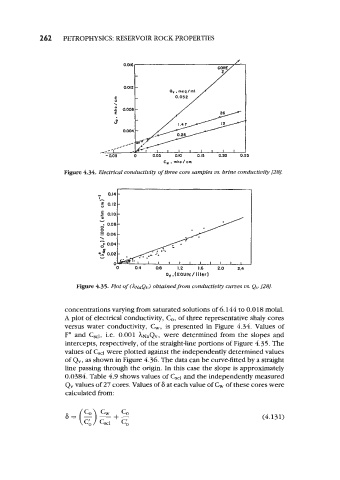
Figure 4.34. Electrical conductivity of three core samples us. brine conductivity [28J.
- 0*141
9 0.12
-
5
i- 0.10
0
o- 0.08 -
- //
0
= 0.06-
\
a* 0.04 - .
P,,(EOUIV./ liter)
Figure 4.35. Plot of (&QV) obtained from conductivity cuwes us. Qv f28J.
concentrations varying from saturated solutions of 6.144 to 0.018 molal.
A plot of electrical conductivity, Co, of three representative shaly cores
is
versus water conductivity, G, presented in Figure 4.34. Values of
F* and C,1, i.e. 0.001 ~N~Q~, determined from the slopes and
were
intercepts, respectively, of the straight-line portions of Figure 4.35. The
values of C,,I were plotted against the independently determined values
of Qv, as shown in Figure 4.36. The data can be curve-fitted by a straight
line passing through the origin. In this case the slope is approximately
0.0384. Table 4.9 shows values of Cscl and the independently measured
Qv values of 27 cores. Values of 6 at each value of C, of these cores were
calculated from:
(4.1 3 1)