
Page 300 - Phase Space Optics Fundamentals and Applications
P. 300
Self-Imaging in Phase Space 281
based on the Fourier transform of the signal
∞
˜ u( ) = u(x) exp(−i2 x) dx (9.3)
−∞
Intensity and power spectrum of the complex signal can be recov-
ered as the marginals of the WDF, i.e., the projections parallel to the
phase-space axes
∞ ∞
2 2
W(x, ) d =|u(x)| and W(x, ) dx =|˜u( )| (9.4)
−∞ −∞
In fact, it is possible to regain the original signal, apart from a constant
factor, as a Fourier transformation of the WDF, proving that the WDF
is a complete representation of the complex amplitude.
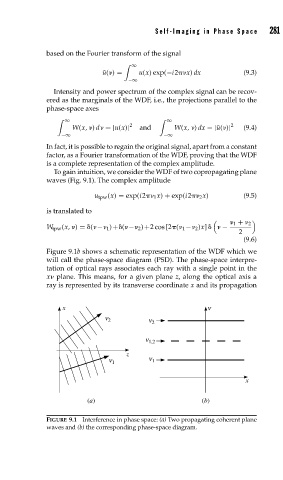
To gain intuition, we consider the WDF of two copropagating plane
waves (Fig. 9.1). The complex amplitude
u tpw (x) = exp(i2 1 x) + exp(i2 2 x) (9.5)
is translated to
1 + 2
W tpw (x, ) = ( − 1 )+ ( − 2 )+2 cos [2 ( 1 − 2 )x] −
2
(9.6)
Figure 9.1b shows a schematic representation of the WDF which we
will call the phase-space diagram (PSD). The phase-space interpre-
tation of optical rays associates each ray with a single point in the
x plane. This means, for a given plane z, along the optical axis a
ray is represented by its transverse coordinate x and its propagation
x n
n 2 n 2
n 1,2
z
n 1 n 1
x
(a) (b)
FIGURE 9.1 Interference in phase space: (a) Two propagating coherent plane
waves and (b) the corresponding phase-space diagram.